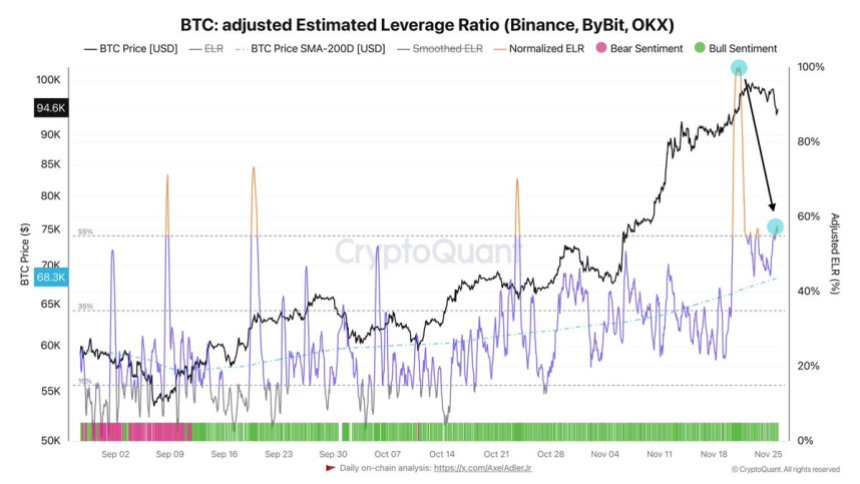
2024-12-6 05:36 |
Bitcoin price declined sharply from the $104,015 high and dipped below $95,000. BTC is now recovering losses and facing hurdles near $99,000.
Bitcoin started a major decline after hitting a new all-time high at $104,015. The price is trading above $97,500 and the 100 hourly Simple moving average. There is a key bullish trend line forming with support at $96,000 on the hourly chart of the BTC/USD pair (data feed from Kraken). The pair could regain momentum if it closes above the key milestone level of $100,000. Bitcoin Price Recovers LossesBitcoin price started another increase above the $98,500 resistance zone. BTC was able to clear the $99,500 and $100,000 resistance levels. The bulls even pumped it to a new all-time high.
A high was formed at $104,015 and the price saw a major downside correction. There was a drop below the $100,000 and $95,000 levels. The price tested the $92,000 zone. A low was formed at $91,800 and the price is now recovering losses.
There was a move above the 50% Fib retracement level of the downward move from the $104,015 swing high to the $91,800 low. Bitcoin price is now trading above $97,500 and the 100 hourly Simple moving average. There is also a key bullish trend line forming with support at $96,000 on the hourly chart of the BTC/USD pair.
On the upside, the price could face resistance near the $99,360 level or the 61.8% Fib retracement level of the downward move from the $104,015 swing high to the $91,800 low. The first key resistance is near the $100,000 level. A clear move above the $100,000 resistance might send the price higher.
The next key resistance could be $102,000. A close above the $102,000 resistance might send the price further higher. In the stated case, the price could rise and test the $104,000 resistance level. Any more gains might send the price toward the $108,000 level.
Another Drop In BTC?If Bitcoin fails to rise above the $100,000 resistance zone, it could start another downside correction. Immediate support on the downside is near the $97,000 level.
The first major support is near the $96,000 level. The next support is now near the $95,000 zone. Any more losses might send the price toward the $92,000 support in the near term.
Technical indicators:
Hourly MACD – The MACD is now gaining pace in the bullish zone.
Hourly RSI (Relative Strength Index) – The RSI for BTC/USD is now above the 50 level.
Major Support Levels – $97,000, followed by $96,000.
Major Resistance Levels – $100,000, and $102,000.
origin »Bitcoin price in Telegram @btc_price_every_hour
Bitcoin (BTC) на Currencies.ru
|
|