2024-12-28 03:00 |
The Bitcoin price has struggled to reclaim previous price highs above $100,000, with bearish sentiment dominating the market. Currently, the Bitcoin price is retesting the support line of an Ascending Channel after crashing below $95,000. A crypto analyst has predicted that if it can hold this key support level, it could stage a recovery and skyrocket to its next bullish target, aligning with the upper resistance line of the channel.
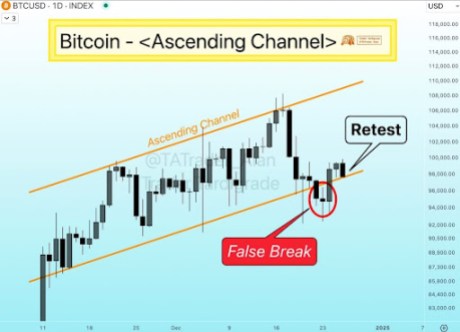
Bitcoin Price Retest Support Line; New Target In SightIn a chart illustrating Bitcoin’s price movement within an Ascending Channel, Trader Tardigrade, a crypto analyst on X (formerly Twitter), revealed that the cryptocurrency has temporarily declined below the lower support line on the channel. The analyst labeled this decline a “False Break,” highlighting that the Ascending Channel remains intact despite the drop.
As indicated by the red circle in the price chart, the False Break suggests that Bitcoin’s brief move below the support level was short-lived and does not confirm the continuation of its previous downtrend. Trader Tardigrade noted that after Bitcoin’s False break, the cryptocurrency quickly moved back into the Ascending Channel to reclaim the lower support line.
Interestingly, Bitcoin’s drop below the False break comes as the pioneer cryptocurrency experienced a sharp price crash below $95,000. Lately, the flagship cryptocurrency has been under significantly bearish pressure, recording notable declines as market volatility intensifies.
Despite this bearish performance, Trader Tardigrade has disclosed that Bitcoin is now retesting the channel’s support line again, aiming to break above and trigger a price reversal. The analyst predicts that if Bitcoin can hold this support line, it will likely continue moving upwards within the channel.
Consequently, the analyst has forecasted that Bitcoin’s next price target would be the upper resistance line of the Ascending Channel. Looking at the price chart, the channel points upwards towards a range between $110,000 and $112,000.
If Bitcoin can successfully recover toward the upper resistance line, it could signal the continuation of a bullish trend within the Ascending Channel. Additionally, a breakout above the resistance line could further validate the bullish momentum, setting up a stage for Bitcoin to potentially target higher price levels and possibly retest its all-time high.
Analyst Says Bitcoin Could Crash To $87,000Bitcoin is currently in a downward trend, experiencing severe price declines despite analysts’ optimistic projections of a price surge. According to crypto analyst Titan of Crypto, the Bitcoin price could see another decline, with the support level at $87,000 being the next target.
However, according to the analyst, a drop to this price low could bring “maximum pain” to both short—and long-term investors. Nevertheless, Titan of Crypto believes this severe price decline could also present a strong foundation for Bitcoin’s next price rally.
He emphasized that price movements are rarely linear, highlighting the crypto market’s inherent unpredictability and volatility. Despite Bitcoin’s bearish behavior, Titan of Crypto confidently predicts that a price rally to $110,000 is inevitable.
origin »Bitcoin price in Telegram @btc_price_every_hour
ETH/LINK Price Action Candlestick Set (LINKETHPA) на Currencies.ru
|
|


