2024-7-25 22:00 |
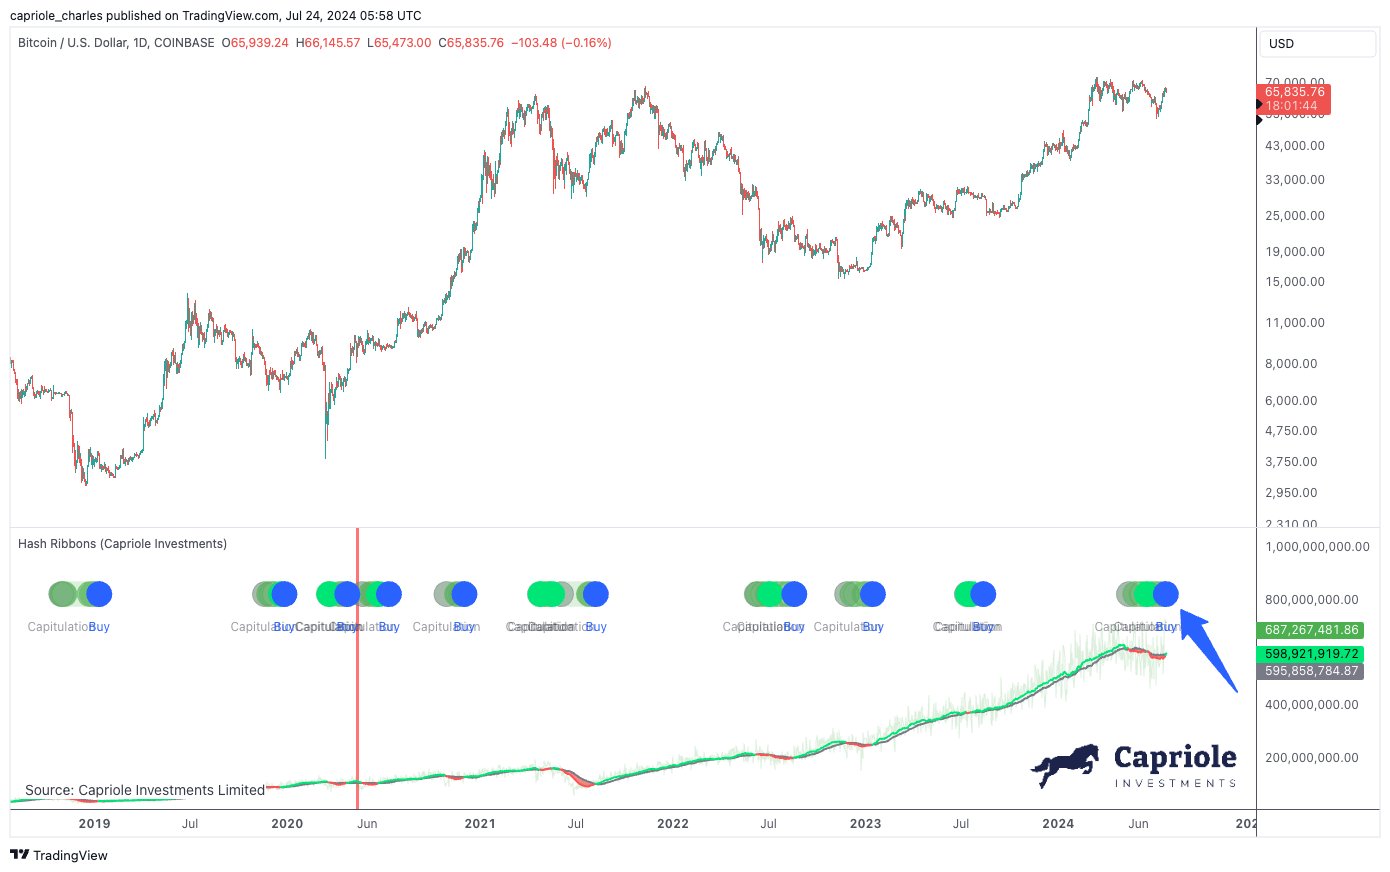
After rising by more than 28% over the 16 days, the Bitcoin price was rejected at key resistance at $68,500 on Sunday. Since then, the BTC price is displaying a slight pullback, but according to Charles Edwards, the founder of Capriole Investments, investors can expect the bullish momentum to continue. Edwards shared the chart below and stated via X, “BREAKING: Hash Ribbon buy signal just fired.”
Why The Bitcoin Hash Ribbons MatterThis statement is significant, as the hash ribbons have historically been a reliable indicator, with an 84% accuracy rate in predicting Bitcoin’s major price bottoms. The hash ribbons are predicated on the interplay between the Bitcoin hash rate—the total computational power used to mine and process transactions—and Bitcoin’s market price.
Analysts observe that a drop in Bitcoin’s price or an increase in operational costs, such as electricity, may cause miners to halt operations temporarily. This period, known as ‘miner capitulation,’ is crucial because a resumption in mining activity is typically viewed as a bullish signal for Bitcoin’s price.
The indicator itself is derived from the moving averages of the Bitcoin hash rate; specifically, the 30-day and 60-day moving averages. A ‘Buy’ signal occurs when the shorter-term moving average crosses above the longer-term average after a period of miner capitulation, indicating that the worst of the sell-off may be over and a recovery phase is likely imminent.
Crypto analyst Jelle, known on X as @CryptoJelleNL, commented, “Hash ribbons are showing that minor capitulation is over! This signal prints after every halving event, and after major corrections — and suggests the next leg of expansion is just around the corner. Time for 80k+?”
Further supporting the bullish sentiment, the account @DaFinancialPage noted on X, “Miner Capitulation. The Hash Ribbons indicator’s blue buy signal has appeared 19 times. Of those, 16 marked Bitcoin’s macro low, giving it an 84% win rate. The 3 times it didn’t, a major correction followed.”
Thus, the appearance of the hash ribbon ‘Buy’ signal can be interpreted as a strong indicator for the next bullish phase in Bitcoin’s market cycle. However, the three instances when the signal failed to predict a significant rise highlight the inherent risks and uncertainties with every indicator.
Notably, technical analysis aligns closely with the anticipated target of $80,000 discussed by Jelle. The 1.272 Fibonacci extension is sitting at approximately $79,337. However, before a new all-time high can be explored, Bitcoin must secure support at the 0.618 Fibonacci retracement level at $65,943 in the daily chart, which could act as a critical juncture. Subsequent levels at the 0.786 Fibonacci at $69,384 and the 1.0 Fibonacci at $73,767 serve as potential interim targets.
At press time, BTC traded at $66,403.
origin »Bitcoin price in Telegram @btc_price_every_hour
ETH/LINK Price Action Candlestick Set (LINKETHPA) на Currencies.ru
|
|


