2021-3-15 13:26 |
Bitcoin (BTC) price reached a new all-time high of $61,803 on 13 March 2021
Last weekend, BTC price pushed past resistance at $58,000 and $59,000 to reach the landmark $60,000 level against the US dollar. The cryptocurrency even broke above $61k to register a new all-time high of $61,883.
However, although still in a bullish uptrend, Bitcoin price looks set for a short-term pullback. The technical and fundamental picture for BTC/USD suggests that selling pressure is likely to push buyers back towards support levels below the critical $58k level.
BTC price downside correctionBitcoin price will likely continue downwards if bulls do not hold the $58,000 support level. The last few hours have witnessed increased sell-off pressure. After dropping below $60k, BTC price corrected lower and touched lows of $57,300. Bulls tried to push higher but failed to sustain above $58,500.
A strong decrease over the next few hours could see Bitcoin break below support at $57,800, with the $55,000—50,000 range a more likely demand reload zone.
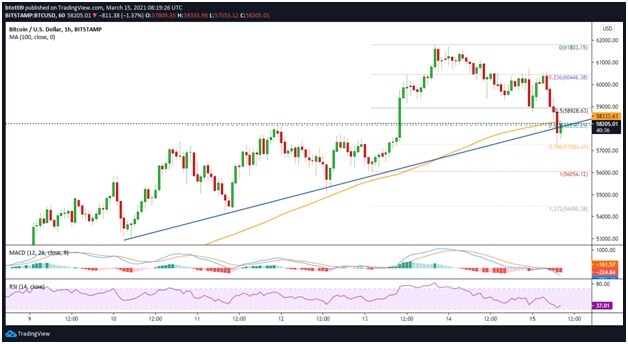
BTC/USD hourly chart. Source: TradingView
The hourly MACD is suggesting growing momentum in the bearish zone, while the hourly RSI remains lodged below the 50 level to give sellers an upper hand. BTC/USD is also trending below the crucial 100-hourly simple moving average ($58,328).
If bears succeed in tanking BTC/USD further, a clear breakdown beyond the ascending trend line (blue) could see prices near the 0.786 Fib level of the upswing from $56,024 to $61,803 high. The resistance-turned-support line is at $57,284.
An extension of the bearish trend could then force bulls to defend gains near the $56k level. A further decline towards the 1.272 Fib level ($54,490) is possible, with the psychological support at $50k level.
BTC price rally to $60k “not US institution-driven”CryptoQuant CEO Ki Young Ju says that Bitcoin’s upside flip past $60k happened with the Coinbase Premium Index significantly lower than when it broke above the 20k, 30k, 40k and 50k levels. As per the analyst, this shows that the bull run to 60k, and the new ATH was “not US institution-driven”.
Coinbase Premium is an index that shows the difference in BTC price on Coinbase and Binance. As per the chart below shared by Ki Young Ju, the latest rally came with a 0.55% premium with a spike in stablecoin deposits the reason. According to the analyst, the move could signal a bearish turn for Bitcoin price.
“It’s not good for the bull market if the buying power continues to come from stablecoins. If so, as soon as this exchange stablecoins reserve dries up, we’re done.”
Exchange stablecoin and BTC price chart. Source: Ki Young Ju on TwitterAt the time of writing, BTC/USD has retreated 4.5% over the past 24 hours to trade around $58,205. Bulls are trying to retake control above the critical 100-hourly SMA, which could provide for increased buying towards the $59k resistance line. A retest of $60k could set bulls on course for a new high.
If the bearish outlook confirms, Bitcoin’s price could break lower and touch levels in the $55k—$50k range.
The post Bitcoin price faces downside correction after flirting with $62k appeared first on Coin Journal.
origin »Bitcoin price in Telegram @btc_price_every_hour
ETH/LINK Price Action Candlestick Set (LINKETHPA) на Currencies.ru
|
|


