2020-11-25 15:35 |
Bitcoin is looking to retest resistance at highs of $19,442 as bulls scheme for a final leg towards a new all-time high
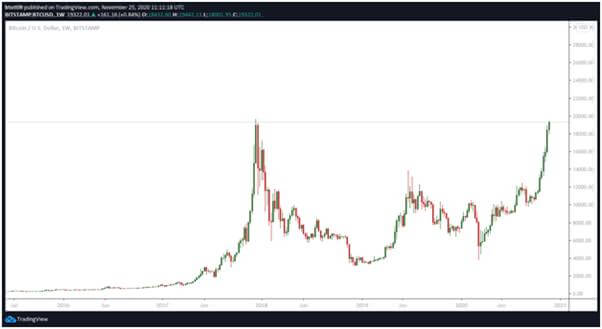
Bitcoin (BTC) has been truly unstoppable these past few weeks. As seen on the chart below, the bellwether cryptocurrency has rallied to new highs after a new high in 2020. Yesterday, bulls pushed BTC to $19,442 before retreating to seemingly re-energise for another uptrend.
The next few sessions could be where BTC price finally breaks above its all-time high of $20,000.
Bitcoin weekly price chart. Source: TradingView
BTC/USD daily chartAt the time of writing, BTC is trading around $19,357 having posted an intraday high of $19,365. Although the price dipped to $18,640 during the early Asian trading session, it crucially remained above the middle point of an ascending channel that has been in place since early mid-October.
But then again, it’s worth noting that the current momentum could be stalled again. If that happens, another flip to the upper half of $18,000—$19,000 could materialise.
This scenario is likely given the RSI on the daily chart is flat-lining and might cut lower. However, it currently remains well within the overbought territory; to suggest there is still plenty of buy-side pressure that could propel bulls to the moon.
To achieve this, bulls need to hold near or just above $19,000. The next target is to rally past the $19.4K high and retest the upper boundary of the ascending channel.
BTC/USD daily chart. Source: TradingView
Also positive for bulls is that BTC/USD has traded above all simple moving averages since 10 October. Staying above the 50-SMA is especially highlighted as a bullish signal.
Furthermore, the shorter-term moving average is cutting above both the 100 and 200 SMAs to indicate bulls are still hungry for more.
BTC/USD 4-hour chartThe 4-hour chart draws a similar picture to the daily chart in that prices are trending north alongside upturned moving averages. As above, the outlook on the 4-hour chart also has the 50-SMA crossing above the longer simple moving averages.
But traders should expect a pullback or so before BTC/USD hits the coveted target. According to crypto trader and technical analyst Josh Rager, the retreat would be nothing but a normal market trend.
“Even the most bullish asset in history has a pullback on occasion”, he noted on Twitter after Bitcoin corrected to lows of $18,640.
BTC/USD 4-hour chart. Source: TradingView
If BTC/USD slides below $19,000 on the 4-hour chart, the 50-SMA ($18,312), 100-SMA ($17,093) and 200-SMA ($15,464) provide support areas.
Longer-term, a bearish flip for Bitcoin will see bulls try to defend gains at the 50, 100 and 200 SMA levels. The daily chart has prices lined up near $14,312, $12,614 and $11,228 respectively, for each of the three moving averages.
The post Bitcoin on the threshold of price discovery above $20,000 appeared first on Coin Journal.
origin »Bitcoin price in Telegram @btc_price_every_hour
Bitcoin (BTC) на Currencies.ru
|
|


