Bitcoin Indicator Hits Historical Low Not Seen Since 2015

2022-5-3 22:36

Bitcoin bulls continue to be demoralized, as the price per coin grinds continuously at lows for what feels like an infinite amount of time. However, a bottom could be forming, according to an indicator that has reached historical lows not seen since the 2015 bear market bottom.

What followed the last signal, was 10,000% returns and Bitcoin became forever became a household name. While such returns aren’t likely a second time, such oversold conditions could yield some significant, unexpected upside. Here is a closer look at the 3-day Stochastic on BTCUSD price charts.

The Stochastic Oscillator Explained

The Stochastic oscillator is a a range-bound momentum indicator that uses support and resistance levels, created by investment educator George Lane in the 1950s. According to Wikipedia, “The term stochastic refers to the point of a current price in relation to its price range over a period of time. This method attempts to predict price turning points by comparing the closing price of a security to its price range.”

Related Reading | Bitcoin Perfectly Follows Market Cycle Comparison, What Comes Next For Crypto?

The formula provides an asset’s price expressed as a percentage of its price range between 0% and 100%. The goal of the Stochastic – often called Stoch for short – is to spot when prices close near the extremes of a recent range. It is at this point where reversals are most likely to occur. Simply put, the lower the reading, the more oversold and the more likely a bounce is due. The higher the reading, the higher the likelihood of a rejection due to overbought conditions.

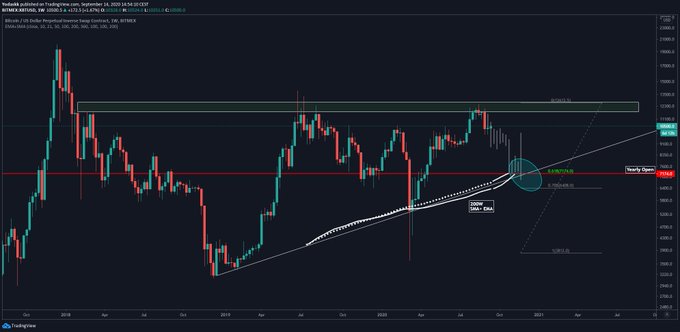
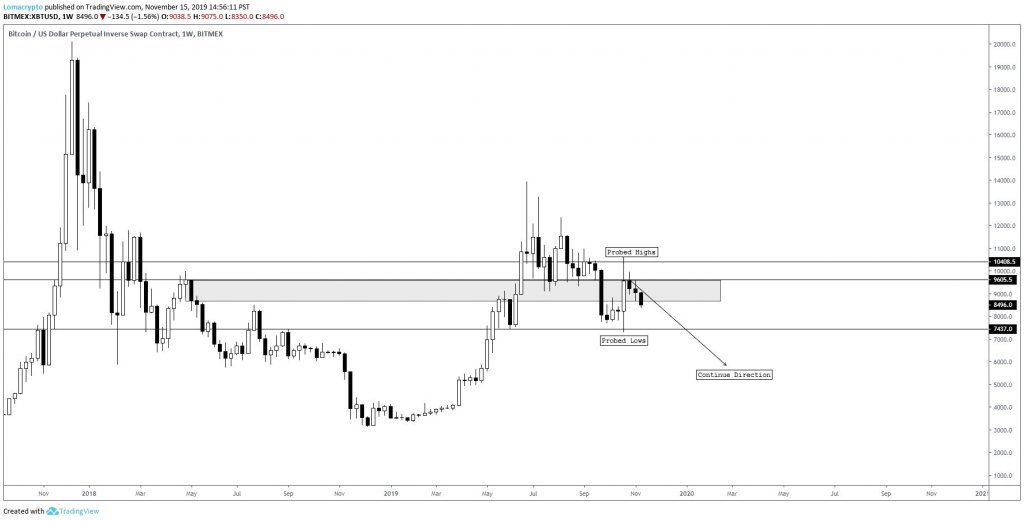
BTCUSD saw 10,000%+ ROI following the low | Source: BTCUSD on TradingView.com Bitcoin Bulls Attempt To Put In A Bottom

Currently, Bitcoin price on 3-day timeframes is at the lowest point in its entire history. The only other time as low, was at the 2015 bear market bottom. A second-bottom followed in the months after, followed by price appreciation upwards of 10,000%. From a low of under $200 per BTC, the top cryptocurrency skyrocketed to nearly $20,000. Crypto was put on the map forever after – what happens this time?

For now, bulls aren’t out of the woods. The Stochastic oscillator consists of a fast stochastic (%K) and a slow stochastic (%D). A signal to take action is triggered when these two lines cross. Bears are in the process of defending a 3-day bull cross, while bulls seek to put in a bottom once and for all.

The bullish crossover hasn't yet been completed | Source: BTCUSD on TradingView.com

Both the Stochastic and RSI are used to signal overbought and oversold conditions. The two tools differ in that the RSI measures price velocity, while Stoch relies on the percentage of a trading range formula. According to Investopedia, Stochastic is more effective for a sideways market – exactly what crypto traders are painfully experiencing now.

Related Reading | Time Vs Price: Why This Bitcoin Correction Was The Most Painful Yet

During highly volatile conditions, the Stoch can generate false signals. However, it is hard to ignore a historically oversold signal in Bitcoin for only the second time ever, when the previous precedent provided such profitable results. What will this signal produce this time around?

This is the second-lowest reading of the 3-day stochastic in the entire history of #Bitcoin. Bottom might be in, folks. pic.twitter.com/84UhmWxtNl

— Tony "The Bull" Spilotro (@tonyspilotroBTC) May 3, 2022

Follow @TonySpilotroBTC on Twitter or join the TonyTradesBTC Telegram for exclusive daily market insights and technical analysis education. Please note: Content is educational and should not be considered investment advice.

Featured image from iStockPhoto, Charts from TradingView.com

Similar to Notcoin - Blum - Airdrops In 2024

origin »

Bitcoin (BTC) на Currencies.ru

$ 69321.41 (-0.04%)
Объем 24H $15.177b
Изменеия 24h: 0.01 %, 7d: 0.68 %
Cегодня L: $69321.41 - H: $69735.47
Капитализация $1366.351b Rank 1
Цена в час новости $ 37773.05 (83.52%)

bottom lows bitcoin 2015 indicator seen historical

bottom lows → Результатов: 106


PrimeXBT Lists Cardano Following Alonzo Hard Fork And Smart Contract Update

Over the last several weeks, the peer-reviewed blockchain Cardano and its native crypto asset ADA have been on an absolute tear, adding to a year-to-date rally of more than 1,000% ROI. From Black Thursday 2020 lows of around two pennies, the now third-ranked cryptocurrency by market cap trades for $2 apiece, highlighting a monster 18,000% surge from the bottom.

2021-9-16 21:08


Фото:

This 2017 Fractal Suggests Bitcoin is About to Go Parabolic

Bitcoin has seen some strong price action following its recent dip down to lows of $17,600 The support here allowed bulls to establish this level as a mid-term bottom, and it has been rising ever since Where it trends next will depend largely on the continued reaction to the support existing at $19,000, as the flip of this level from resistance to support has been promising Another sustained break below this level could be a […]

2020-12-15 21:00


Фото:

This Pattern Suggests Bitcoin Could Plummet to $12,000 Before Uptrend Continues

Bitcoin and the entire crypto market are showing some signs of strength on this relatively quiet morning for the markets Following a brief bout of trading below $17,000, the benchmark cryptocurrency has firmly reclaimed this price region It is now attempting to push higher as bears lose steam, which could be a sign that its recent $16,400 lows are a long-term bottom Where the market trends in the mid-term will depend entirely on Bitcoin and […]

2020-11-29 20:00


Фото:

Ethereum Taps Key Resistance as Analysts Watch for Rebound to Falter

Ethereum has posted a strong rebound from its recent lows, with bulls pushing the cryptocurrency up to highs of $360 earlier today This upswing proved to be short-lived, and the cryptocurrency has since been rejected at this level Nonetheless, today’s price action has signaled that ETH’s sub-$320 lows may ultimately mark a long-term bottom that is followed by further upside While speaking about this, one analyst explained that although today’s rebound has been strong, it […]

2020-9-6 22:00


The Next Few Weeks Will “Define the Future” of Bitcoin After Breaking Multi-Year Trendline

Bitcoin has risen today in tandem with the traditional markets, finding what appears to be a secure foothold within the lower-$5,000 region. This has allowed the benchmark crypto to begin confirming its recent lows as a mid-term bottom, but it still remains unclear as to where it will trend next. One prominent analyst is now...

2020-3-18 00:30


Ethereum Has Yet to Post a Strong Bottom; Are Fresh Lows Imminent?

Ethereum (ETH) has been moving in tandem with Bitcoin as of late, with BTC’s bullishness allowing the cryptocurrency to put significant distance between its 2020 lows and its current price levels. It is important to note that although ETH appears to have gained a solid foothold within the $170 region, the cryptocurrency has been struggling... The post appeared first on NewsBTC.

2020-1-31 02:00


Фото:

Bitcoin could soon revisit 2020 highs as mid-term bottom forms says analyst

Bitcoin has been caught within a relatively tight trading range over the past week, with BTC oscillating between weekly lows of $8,200 and highs of just under $8,800. The lack of decisive momentum has led some analysts to note that the cryptocurrency’s bullish market structure could be at risk of being invalidated in the near-term, […] The post Bitcoin could soon revisit 2020 highs as mid-term bottom forms says analyst appeared first on CryptoSlate.

2020-1-27 00:16