2024-11-26 18:00 |
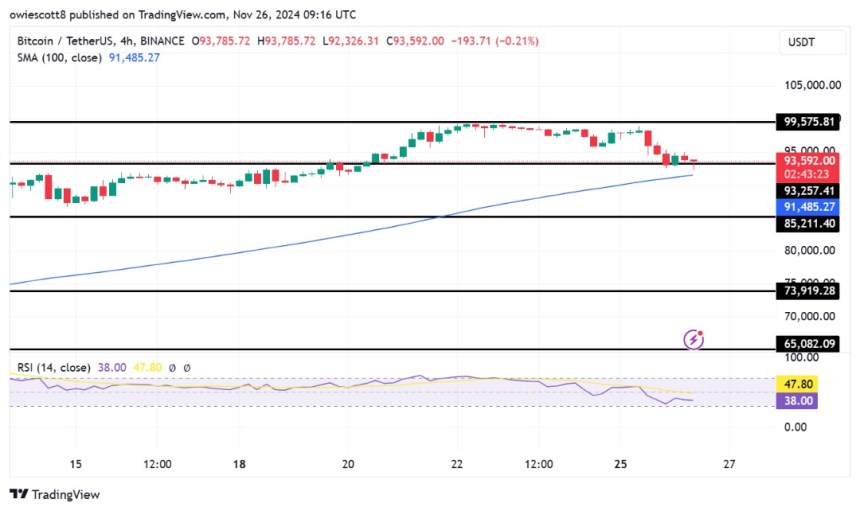
Bitcoin (BTC) stands firm at $93,257, a crucial support level that could determine its next major move. As the battle between bulls and bears intensifies, the stakes are high: a successful defense could spark renewed momentum, while a break below might trigger significant losses.
As the market navigates this pivotal moment, this article aims to analyze BTC’s current position at the critical $93,257 support level, exploring the factors influencing its price movement. By examining key technical indicators and market dynamics, the goal is to assess whether the bulls can defend this level and potentially drive a rebound or if a break below could cause deeper losses.
Analyzing The Recent Price Action Of BitcoinBitcoin is facing a bearish trend, attempting to break below the $93,257 support level. If this continues, BTC could test the 100-day SMA on the 4-hour chart, which could act as support or signal further weakness. A failure to hold above this level might lead to a deeper correction and possibly more notable losses toward lower support zones.
The 4-hour Relative Strength Index (RSI) analysis shows that BTC may continue its decline, as the RSI has dropped to 35%, indicating increasing selling pressure. A reading below 50% suggests a weakening bullish trend and raises the likelihood of more declines. If the RSI continues to dip, it could signal that Bitcoin is entering a prolonged bearish phase.
Despite trading above the key 100-day SMA, Bitcoin is showing strong negative momentum on the daily chart, highlighted by bearish candlesticks and increasing selling pressure. This suggests that the crypto asset is struggling to sustain its upward strength, and if the downtrend continues, it may lead to large corrections and test lower support levels.
Lastly, the RSI on the daily chart has dropped to 63% from the overbought zone, signaling a shift in market sentiment. This implies that buying pressure is easing, and the bullish momentum may be weakening. A move away from the overbought area could signal the start of a consolidation phase or the onset of a corrective pullback.
Potential Scenarios: Rebound Or Breakdown?As Bitcoin tests key support levels, a rebound or a breakdown is expected. Thus, if the bulls manage to defend critical levels like $93,257, BTC witness a rebound, gaining upside strength and targeting its previous high of $99,575. Furthermore, a break above this level may pave the way for the digital asset to set new highs, extending the bullish trend.
However, if selling pressure intensifies and BTC successfully breaks below the $93,257 mark, it could drop through key support zones, potentially triggering further declines toward the $85,211 support range and beyond.
origin »Bitcoin price in Telegram @btc_price_every_hour
BullshitCoin (BULLS) на Currencies.ru
|
|


