Bitcoin ‘HODL Waves’ Chart Shows Price Building Momentum

Bitcoin ‘HODL Waves’ Chart Shows Price Building Momentum
фото показано с : bitcoinist.com

2019-5-2 03:00

Woobull.com, a provider crypto asset market, and network data has added new charts to its Bitcoin price, momentum, volume, and volatility platform.

Bitcoin Price Building ‘Momentum’

The news was originally announced in a tweet by Willy Woo, market analyst and founder of Woobull.com

The “Bitcoin Momentum Chart” appears to lead the price of bitcoin  (Similarly to the RSI and MACD, but specifically for bitcoin) as changes in crowd psychology tend to happen before prices do.

As Bitcoinist has written before, Bitcoin’s price is typically followed by public interest.

The indicator is also seemingly able to quantify price trends based on bull markets and changes in momentum plotted on a separate line graph. This indicator could help traders understand if a strong price trend is in force.

It should be noted that there is already a directional movement indicator that was developed in the 1970s named the Average Directional Index (ADX). The ADX appears to follow the same premise as the Bitcoin Momentum Chart — although this new chart might be easier for new traders to read and therefore understand.

Signaling and investment-related charts

Woobull seemingly offers traders and investors charts and data that they cannot easily find online. For instance, many, (if not all) of the charts on Woobull are sourced outside of the mainstream technical analysis sites such as tradingview.com or CoinMarketCap.

The site, therefore, might be more suited towards investors who look at long-term and secular trends than swing or day traders that look at the hourly candles. Still, the information provided from Woobull remains objectively useful for anyone with a technical or financial interest in Bitcoin.

One interesting chart above is titled “Bitcoin Risk Adjusted Returns vs Other Assets.” The chart is used to “compare Bitcoin ROI, adjusted for its risk, to other assets.”

Another graph to pay attention to is its “HODL Waves” which claims to offer “A cross-sectional view of Bitcoin HODLers over time, shows demand and supply from new and old HODLers.”

The Bitcoin Valuation cap shows “a collection of useful valuation metrics on Bitcoin.”

The Bitcoin NVT ratio shows when the currency is either overbought or oversold, which functions identically to the existing calculations of the RSI or stochastics that also measure extreme readings.

Bitcoin monetary and network statistics

The below chart shows the difference between Bitcoin’s network value and network volume.

The graph below claims to “chart user-centric metrics tracking network congestion, e.g. payment fees, confirmation times.”

The graph below shows the growth (inflation) of bitcoin over time.

In closing, there are many more charts that WooBull offers that will be of interest to anyone invested in Bitcoin. Interested Bitcoiners are encouraged to check them out.

Will you be using Woobull in future? Let us know in the comments!

Image source: Woobull.com, Shutterstock

The post Bitcoin ‘HODL Waves’ Chart Shows Price Building Momentum appeared first on Bitcoinist.com.

Similar to Notcoin - TapSwap on Solana Airdrops In 2024

origin »

MobileBridge Momentum (CHF) на Currencies.ru

$ 60215.43 (+0.00%)
Объем 24H $0
Изменеия 24h: 0.00 %, 7d: 0.00 %
Cегодня L: $60026.24 - H: $61707.88
Капитализация $0 Rank 99999
Цена в час новости $ 5417.36 (1011.53%)

bitcoin momentum price building chart market shows

bitcoin momentum → Результатов: 126


Фото:

Bitcoin Bullish Momentum Reignites: RSI Signals Potential Surge To $65,000

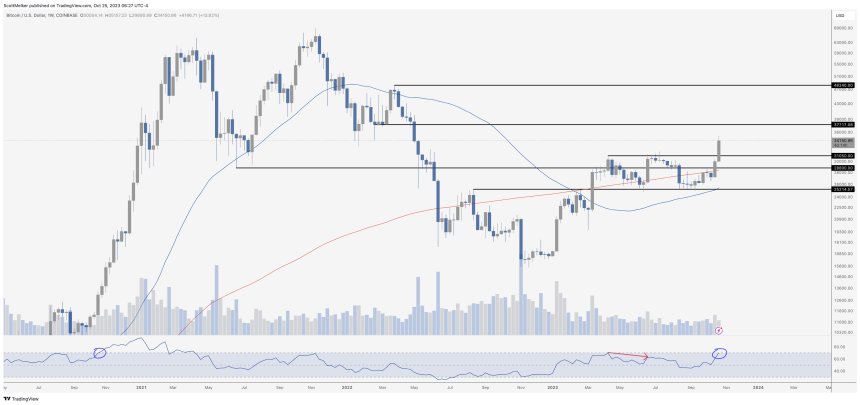
After experiencing a brief correction from its new yearly high of $35,300, Bitcoin (BTC), the leading cryptocurrency in the market, is showing signs of renewed bullish momentum.   As the digital asset approaches the $35,000 mark again, a key indicator is following patterns observed in 2020, suggesting a potential surge that could propel Bitcoin to reclaim its previous peak of $65,000.

2023-10-26 05:00


Bitcoin Momentum Likely to Continue as Bulls Shatter Critical Resistance

Bitcoin has seen some massive momentum throughout the past few days, with the cryptocurrency’s price rallying to new highs over $30,000 as its uptrend turns parabolic Where the cryptocurrency trends in the mid-term will undoubtedly depend on whether or not bulls can maintain full control of the crypto’s upswing or if it will post a […]

2021-1-3 00:00


Фото:

Here’s Why This Break Above $12,000 is Different from Past Bitcoin Rallies

Bitcoin’s price has seen some significant momentum throughout the past few days The cryptocurrency is currently trading at the highest price it has been at since before the summer rally came to an end This momentum appears to be the result of a confluence of different factors, including growing BTC adoption amongst corporations Just today, PayPal announced that they are planning to rollout cryptocurrency buying, selling, and storage features to all of their users Bitcoin, […]

2020-10-22 02:00


Фото:

Bitcoin’s Volume Profile: Move Past $12,000 Will Ignite Bull Run to $16,500

Bitcoin’s price action has grown stagnant over the past few days and weeks, with the cryptocurrency struggling to gain momentum as bulls and bears battle for control of its near-term trend. Last week, the benchmark digital asset incurred some serious momentum after news broke regarding Square’s acquisition of $50 million worth of BTC. This news […]

2020-10-14 00:00


These 4 Factors Signal Bitcoin is Gearing Up for a Breakout Rally

The crypto market is heading into the weekend without any clear momentum, as the past week has been relatively quiet for Bitcoin Many altcoins are still maintaining their firm upwards momentum, although this appears to be slowing down as investors grow more concerned about where Bitcoin may trend next There are four factors that one analyst is closely observing that could provide BTC with better guidance in the near-term This comes as the cryptocurrency continues […]

2020-7-19 19:00


Фото:

60% of Bitcoin Options Open Interest Expires in 6 Days; Will Fireworks Ensue?

The crypto market has continued extending its long-held consolidation phase, with this sideways trading largely coming about as a result of Bitcoin’s lack of momentum Analysts are now noting that it may persist further in the near-term, as there are no immediate catalysts for momentum One factor that could lend itself towards shifting this trend is the expiry of 60% of all Bitcoin options next week Close to $1 billion in contracts are expiring on […]

2020-6-20 19:00


Фото:

Bitcoin Price Analysis: Is this a Relief Rally or a Bullish Reversal?

Bitcoin has recovered nearly 13% after scraping its knees on a new 2018 low, but is the current uptick in momentum just a relief rally or the makings of a bullish reversal? Market Overview After scraping the bottom of the barrel last week, Bitcoin appears to have mustered enough short-term momentum to attempt a bull reversal but, at the time of this writing, this is yet to be determined.

2018-7-4 10:00


Фото:

Bitcoin Price Analysis: New Low on Low Volume Breeds Potential Bullish Set-up

Bitcoin sits precariously perched at the bottom of the annual market low and many bitcoin investors aren’t sure what to make of it. Although the market seems to be continuing its drift to new lows with greater and greater ease, there are a couple of bullish signals worth considering while the market continues to consolidate: Figure 1: BTC-USD, Daily Candles, New Market LowOn Friday, June 29, 2018, for the first time this year, the daily candles closed below the annual low of $6,000s.

2018-7-1 19:35