2025-2-14 00:30 |
The crypto market has been experiencing significant volatility, with the Bitcoin price leading the charge. Over the past month, BTC has been trading sideways, recording declines that have pushed its value below the $100,000 mark. As analysts speculate about the cryptocurrency’s next major move, recent data suggests that a classic Flag Pole pattern is beginning to emerge on the Bitcoin price chart. The crypto analyst who has identified this pattern has shared a bullish roadmap prediction for Bitcoin, projecting that it could rise to a new all-time high above $120,000.
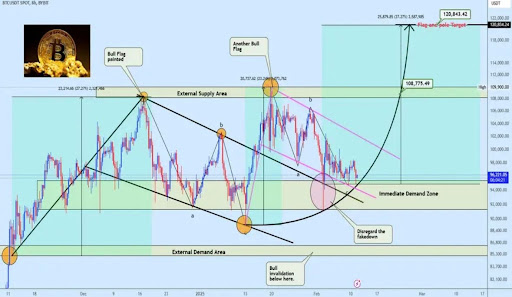
In a TradingView analysis, crypto expert Weslad expressed optimism about Bitcoin’s future trajectory, projecting that it could soar as high as $120,843 in this bull cycle. The analyst highlighted the current formation of a classic Flag Pole pattern on the BTC price chart. The emergence of this distinct technical pattern in the Bitcoin structure has sparked an enthusiastic response from analysts, as they anticipate a massive breakout to the upside.
Roadmap To $120,000 Bitcoin Price Target According to the TradingView analyst’s chart, the Bitcoin price faced a rejection at an external supply area after experiencing an impressive 27% rally from a strong external demand zone between $$85,300 and $86,800. This rejection was a critical moment for the cryptocurrency, as it sparked the creation of what many experts call a perfect Bull Flag formation.This bull flag pattern is typically known as a bullish continuation signal during an uptrend. It represents a halt in a cryptocurrency’s upward movement before the trend resumes. In the case of Bitcoin, Weslad suggests that its recent rejection is not viewed as a downturn but rather as a smart money accumulation zone designed to shake out weaker hands who panic during market declines.
Despite its pullback, Bitcoin’s recent price action has demonstrated a strong resilience in an immediate demand zone between $91,000 and $95,000. The analyst also describes this correction as a “fake down,” noting that it was due to liquidity engineering. This strategic liquidity grab allows large players to accumulate BTC at favourable prices before the next significant move upward.
While noting the Flag Pole formation, Weslad also highlights a recent breakout from a Descending Channel that has previously restricted Bitcoin’s price movements. This channel breakout signals the possible resurgence of Bitcoin’s bullishness, with the analyst predicting an initial surge to $108,089.
If Bitcoin can maintain a positive momentum, the pathway to an ultimate Flag Pole target of $120,843 becomes plausible.
Monitoring Breakout SignalsWhile Weslad projects a new all-time high for Bitcoin at $120,843, the analyst also emphasizes important signals that could indicate an imminent breakout. He revealed that if Bitcoin can successfully flip the aforementioned external supply zone between $108,000 and $109,000, the cryptocurrency could see its price skyrocket to new highs.
At the time of writing, Bitcoin’s price is $96,142, marking a 2.25% decline over the past week.
origin »Bitcoin price in Telegram @btc_price_every_hour
ETH/LINK Price Action Candlestick Set (LINKETHPA) на Currencies.ru
|
|


