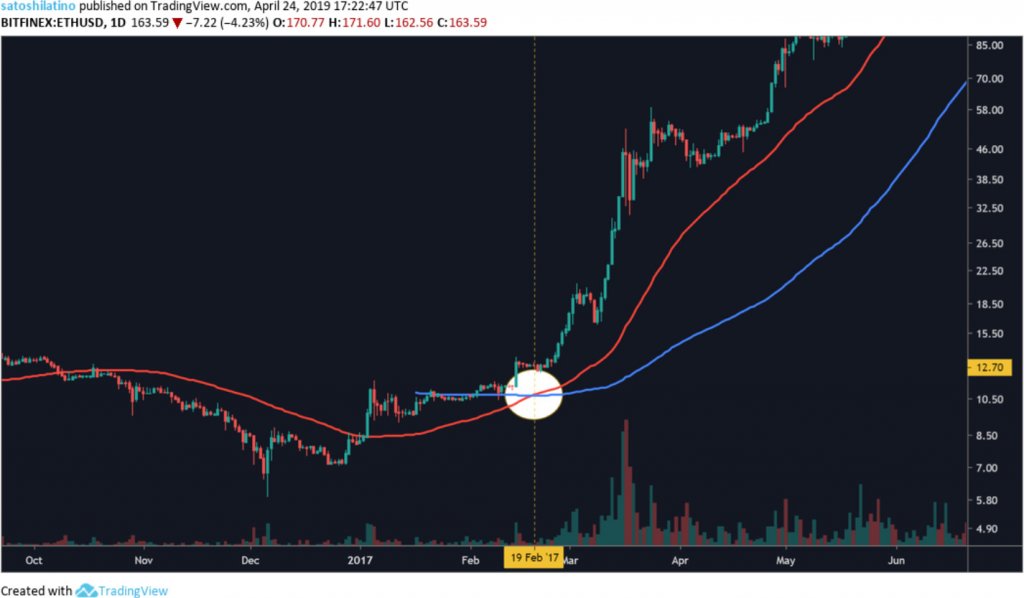
Bitcoin recently made a “Golden Cross” where the 50-day moving average closed above the 200-day moving average, a positive development for traders who see it as a very bullish indicator. However, the benchmark cryptocurrency fell sharply right after forming the bullish crossover.
The bitcoin-to-dollar exchange rate slipped below both the 50- and 200-DMA earlier this week, going against the perceived upside sentiment that was led by the Golden Cross formation. The pair on Friday established a weekly low at $8,428.80. At its week-to-date high, it was trading at $10,030 on US crypto exchange Coinbase.
BTC/USD slips below its bullish Golden Cross | Source: TradingView.com, Coinbase
Bitcoin fell into a sell trap shortly after investors started losing faith in global stocks and commodities. Sitting atop attractive profits, the cryptocurrency became an attractive asset among people who were looking to generate cash. They sold anything for bid and ran under the safety of whatever they perceived was their haven.
Even Gold, often treated as an outdated version of a digital bitcoin, slipped huge ahead of closing the week. Investors sold it for hard cash, similar to how they did during the 2008 financial crisis.
Despite today's decline, the price of #gold is still up over 6.5% so far this year. Yet the GDX, an index of gold mining stocks is down almost 10%. Traders still don't get it. Gold is headed much higher, as are the earnings & reserve values of companies that mine it. Buy the dip!
— Peter Schiff (@PeterSchiff) February 28, 2020
Little Predictive Power
Bitcoin’s downside moves showed that investors, in general, did not treat the Golden Cross as a signal to enter the market. The trend also presented that the indicator has little predictive power against severe macroeconomic fundamentals. Sometimes, the prices go up, and sometimes, they go down.
But taking cues from the Dow Jones, a US index that formed the Cross in 2019 for the first time in three years, one can notice that they tend to give consistently positive results after six months or so. The Dow had surged by more than 14 percent as of February 12, 2020, after making the Golden Cross on March 19 last year.
DJI plunges below its moving averages as well | Source: TradingView.com
The super-bullish technical indicator failed nevertheless, hit by the spreading of the Coronavirus in and outside China. Even the Dow fell below its own Golden Cross in the latest sell-off, showing how investors just wanted liquidity. Bitcoin, which had surged by more than 40 percent before the plunge, stood no chance.
Hopeful Tomorrow for Bitcoin
On Friday, the US Federal Reserve came to rescue the market by assuring investors that “the fundamentals of the US economy remain strong.” Nevertheless, the chairman Jerome Powell also said that they would “ act as appropriate to support the economy.”
“The coronavirus poses evolving risks to economic activity. The Federal Reserve is closely monitoring developments and their implications for the economic outlook,” he stated.
The statements came at the time when the market clamored for the Fed to introduce fresh rate cuts. Unlike the European Central Bank, whose dovish policies have pushed the rates way below zero, the Fed still has scope to trim its own. They are currently 1.5 percent to 1.75 percent.
Easy borrowing could give investors more money to support their portfolios. Some part of that cash could also reach bitcoin, leading it to continue the uptrend above the Golden Cross, especially in the wake of its own supply rate cut in May 2020. origin »
Over the past few days, all anyone could talk about on Crypto Twitter was the golden cross that had formed on Bitcoin’s one-day chart. For those unaware, a traditional golden cross in technical analysis is when an asset’s 50-day simple moving average crosses above its 200-day moving average, suggesting that a decisive bull trend is […]
The post This weird Bitcoin pattern suggests Wednesday’s 10% dump may precede a massive surge appeared first on CryptoSlate.
The 'Golden cross' is one of the simplest indicators in technical analysis. It is the situation where two moving average lines (50MA and 200MA) cross each other
Bitcoin (BTC) just added another huge factor to the bullish case, as a golden cross of the 50-day and 200-day moving average appears on the daily chart. Bitcoin 50-Day MA Crossed Over, Sparking Expectations of Big Rally Bitcoin prices managed to bounce quickly from a dip close to the $9,500 level.
Is the price of bitcoin preparing for a massive price rally ahead? Many traders believe so. The optimistic sentiments emerge owing to a potentially bullish factor. The bitcoin’s 50-daily moving average this Tuesday inched above its 200-daily moving average, a pattern known as Golden Cross.
In stocks and cryptocurrencies, the golden cross represents the move of 50-day moving average above the 200-day moving average. Since the 200-day moving average is an important indicator that separateThe post Golden cross: Should BTC, Litecoin, XRP and other alts rely on it? appeared first on AMBCrypto.
Bitcoin traders are enthusiastic about a textbook technical indicator whose formation could send the asset’s prices higher. Dubbed as Golden Cross, the candlestick pattern will occur when bitcoin’s short-term moving average closes above its long-term moving average.
A textbook candlestick pattern is showing a very rosy future for Bitcoin SV (BSV). The fifth-largest cryptocurrency by market cap lately formed a Golden Cross – a bullish signal wherein an asset’s short-term moving average closes above its long-term moving average.
Earlier this month, the one-week Bitcoin chart printed an extremely bullish sign: the golden cross of the 50-week and 100-week simple moving averages, with the former crossing above the latter. (As an aside, a golden cross is when a short-term moving average crosses over a long-term one to imply bulls have control.
Last week, the one-week Bitcoin chart printed an extremely bullish sign: the golden cross of the 50-week and 100-week simple moving averages, with the former crossing above the latter. (As an aside, a golden cross is when a short-term moving average crosses over a long-term one to imply bulls have control.
If you’ve been on Crypto Twitter at all over the past few months, you’ve likely noticed the phrase “Bitcoin golden cross” tossed around incessantly. The reason, the leading cryptocurrency’s weekly chart is on the verge of printing what is known as a “golden cross,” when a short-term moving average crosses over a long-term one to.
The Bitcoin price has been decreasing since late October. A bullish cross between long-term moving averages (MA) suggests that it might begin an uptrend. However, similarities to the previous time this occurred are somewhat ambiguous.
Even though it's been less than two months since its launch, Bakkt was the forgotten golden child of the Bitcoin market. Slated to be the prime catalyst that would take the king coin back to its all-tThe post Bakkt in the game: Bitcoin Futures moving away from CME? appeared first on AMBCrypto.
Earlier this month, NewsBTC reported that the market capitalization of all crypto assets, Bitcoin included, printed what is known as a death cross in the land of technical analysis. The ominous-sounding title is given to when a short-term moving average of any asset – the 50-day MA for example – crosses under a long-term moving.
This week has been all about Ethereum. Finally the second largest crypto asset on the planet appears to be moving without the influence of its big brother dictating things. ETH prices are on the up again today and the fundamentals keep improving.
Ethereum’s recent bullish trend has overtaken the bear trend in a golden cross which is usually seen as a highly bullish indicator. The 50 day moving average has overtaken the...
On the back of the most successful week for XRP, the second largest altcoin in the market has broken, what could be equated to the first inkling of the Bitcoin [BTC] bull run. Following Coinbase’s greenlight to its New York customer to engage in XRP trading, the altcoin shattered its 200-day moving average.
Delphi Digital has returned with another installment of its unspent transaction output (UTXO) reports. Recalling its report from January of this year, the research firm says bitcoin’s market cycle is right on track.
By CCN: In the past 30 days, Amazon’s stock (AMZN) has increased from $1,500 to $1,926 year-to-date, surging by more than 28. 4%. The strong momentum of AMZN led a key technical indicator called the short-term 50-day moving average to surpass a long-term 200-day moving average, flashing the infamous “golden cross.
By CCN: Not everyone is convinced that Bitcoin’s highly-touted “golden cross” is a bullish signal for the world’s largest cryptocurrency. Almost 25% of Crypto Investors Believe Golden Cross is Bearish for Bitcoin According to a Twitter survey conducted by crypto bull Thomas Lee, 24% of Crypto Twitter inhabitants believe that the signal, which typically hints at a bull run ahead, is a trap and that it is time to unload some Bitcoin.
After a 2x upward movement in price, Ethereum (ETH), the world’s biggest smart-contract blockchain, has formed its first bullish golden cross since Feb. 19, 2017. Understanding the Moving Averages Prior to diving into a price analysis of the second largest cryptocurrency in terms of market cap, some of the technical terms used in this study […]
The post Ethereum forming bullish technical indicators appeared first on CryptoSlate.
Bitcoin Sees Golden Cross At Last At long last, Bitcoin (BTC) has printed a golden cross on its one-day chart, whereas its 50-day moving average has crossed over its 200-day, signifying that bears might be.
The crypto winter might be over. Bitcoin (BTC), the pioneer cryptocurrency, has formed its first golden cross since Oct. 27, 2015, marking a pivot point for the entire market. Explaining the Terms Before going into details, it is necessary to explain the three primary indicators in this analysis: the moving average, golden cross, and death […]
The post Bitcoin Golden Cross forms—beginning of the bull market? appeared first on CryptoSlate.
For the first time since 2015, the Bitcoin price action has formed a “golden cross” pattern providing yet another signal that BTC is in a bull market. It also broke through the $5,600 price mark, setting a new 2019 high.
Bitcoin’s much-awaited Golden Cross, which many analysts claimed will lead to a resurgence of a bullish market, has been confirmed. The intersection of the 200-day moving average and 50-day moving average, which indicates the Golden Cross, was achieved over the past few hours.
Ether, more commonly known as Ethereum, is the world’s second largest cryptocurrency and it might have turned bullish due to the initiation of the ‘Golden Cross’ in the daily chart.
Bulls finally got the better of stubborn bears as they smashed the $4,200 resistance level to see a sharp 20% Bitcoin price increase. The surge occurred at 07:00 UTC+1 on April 2 and managed to reach $5,000, marking the flagship cryptocurrency’s highest level in 2019.
Last year Stellar Lumens was the golden child of crypto, a Ripple rivaling financial transfer blockchain that promised great things. Its slogan of ‘money moving like email’ is exactly what the world needs right now yet the token has failed to gain much traction in terms of price as XLM has continued to slide down.
Blockchain technology helps with the recycling of mattress foam. ChemChain for Mattress Foam Sustainability According to a report by Ledger Insights published on May 1, Dow Polurethanes – an offshoot of Dow – recently announced a pilot to tap ChemChain blockchain to aid with the recycling of mattress foam. For those not in the know,Read More
The Dow Jones dropped by more than one percent on September 3 following several weakened futures trading sessions, dropping 285 points as the U. S. and China imposed additional sanctions over the weekend, triggering conversations about a possible recession.
President Trump's trade war tactics appear to have backfired, as evidenced by the spiraling performance of the Dow Jones Industrial Average. While most Dow components are trading in the red, there are some winners, and an unlikely hero is leading the charge.
President Trump’s trade war tactics appear to have backfired, as evidenced by the spiraling performance of the Dow Jones Industrial Average. While most Dow components are trading in the red, there are some winners, and an unlikely hero is leading the charge.
By CCN: On Friday, the Dow Jones surged by 1. 02 percent, nearing 26,000 points after gaining more than 1,000 points within five days, demonstrating the current momentum of the U. S. stock market.
By CCN: Despite today’s 2% rally in the stock market, critical support levels have been breached that may signal the beginning of a 50% market decline. The Stock Market Is Falling Apart With the stock market trading at its third most expensive level in history, led by outrageously overvalued FANG and growth stocks, it’s only a matter of time before it regresses to its mean valuation.