Bitcoin Eyes New Yearly Highs, Buy Pressure Skyrockets

2020-11-17 22:13

Bitcoin continues to lead the uptrend in the cryptocurrency market. Its price rose over 4% following Monday’s open, and on-chain metrics point to further gains on the horizon.

Bitcoin Sees Largest Capital Influx to Date

The flagship cryptocurrency has been on a roll lately, surging more than 10% in the past week. As more billionaires increase their BTC holdings to hedge against a global financial downturn, the upward pressure quickly builds.

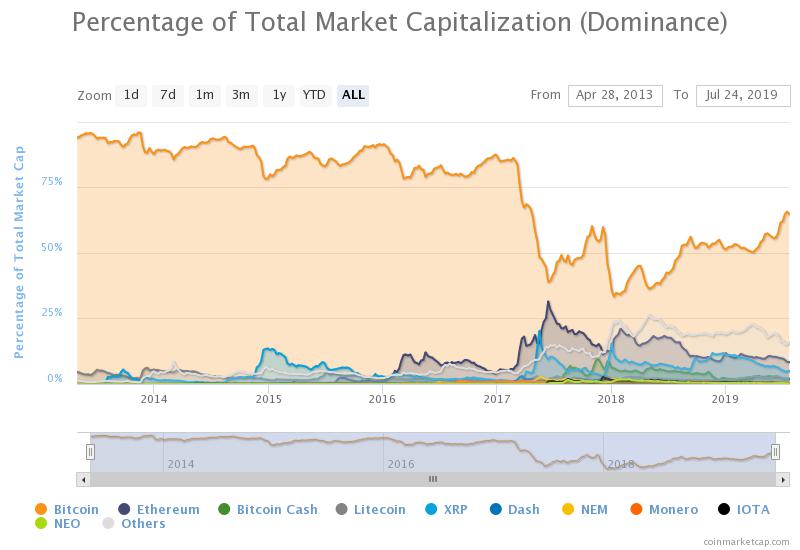
On-chain analyst Willy Woo maintains that the capital influx into Bitcoin is at its highest rate to date based on the average price investors paid per token.

For this reason, the on-going bullish momentum can be described as “organic.”

Woo indicated that prices are currently positively correlated with investors’ capital entering and leaving the market.

Realised Price estimates the average price the market paid for their BTC.

Now at its steepest slope for this cycle, meaning capital influx into #Bitcoin is at its highest rate since the last bull market.

(Higher than last year's $4k-$14k move; the current move is more organic.) pic.twitter.com/fF3Cn8glfA

— Willy Woo (@woonomic) November 15, 2020

The bullish outlook is further validated by a continuous increase in the number of whales on the network. Data from the behavior analytics platform Santiment reveals that addresses with 10,000 to 100,000 BTC are up nearly 7% in the past month.

Roughly seven new whales have joined the network since Oct. 21.

BTC Holders Distribution by Santiment

Paolo Ardoino, CTO at Bitfinex, believes that Bitcoin’s increasing interest comes after investors realized that this digital asset represents a “monumental technological shift” in money evolution.

“The backdrop to the recent strong price performance are fundamentals that include banks launching more crypto services and increasing institutional investment in the asset, along with the notion of state-backed digital currencies becoming ever more pervasive,” said Ardoino.

While investors flock to the cryptocurrency market, resistance is drastically diminishing.

IntoTheBlock’s “In/Out of the Money Around Price” (IOMAP) model reveals little to no significant supply barriers ahead of Bitcoin.

The only potential obstacle to overcome lies at $16,800, where 53,000 addresses had previously purchased 90,000 BTC. Slicing through this relatively weak resistance wall could lead to a further advance towards $18,560.

In/Out of the Money Around Price by IntoTheBlock

Everything seems to point out that Bitcoin is bound for higher highs. The bullish thesis is qualified by stable support. The IOMAP cohorts show that nearly 450,000 addresses bought over 740,000 BTC between $15,200 and $15,700.

This massive demand zone may have the ability to absorb some of the selling pressure in the event of a sudden correction.

Similar to Notcoin - Blum - Airdrops In 2024

origin »

EYES Protocol (EYES) на Currencies.ru

$ 0.0037959 (+1.60%)
Объем 24H $5.974k
Изменеия 24h: 5.18 %, 7d: -26.63 %
Cегодня L: $0.0018373 - H: $0.0037959
Капитализация $0 Rank 3113
Цена в час новости $ 0.0036588 (3.75%)

buy pressure skyrockets highs yearly eyes new

buy pressure → Результатов: 65


Buying Bitcoin at $8k or $9k Won’t Matter in 2 Years: Fund Manager Explains

The past few weeks have seen Bitcoin stall in the $9,000s as bulls have failed to maintain the pressure they applied starting after March’s crash. With the indecision in the cryptocurrency market and global markets more broadly, investors have been deliberating purchasing BTC in the $9,000s or waiting for a retracement to “buy the dip.” […]

2020-6-16 03:00


Фото:

Bitcoin Price Analysis: Slow Upward Drift Tests Market Supply

A slow, grinding upward drift has been the name of the game for bitcoin’s market over the last few weeks. The upward drift is bringing us slowly to a level that was previously rejected violently:Figure 1: BTC-USD, Daily Candles, Upward DriftOur third rejection of the red resistance level shown above brought the market into a test of macro support in the mid-$3,000s.

2019-3-23 01:23


Фото:

Bitcoin Price Analysis: Could Three Times Be the Charm for This Resistance Level?

Bitcoin remains in its tightly coiled range as the market continues its sideways trend for the third week in a row. While macro support has been tested three times recently, we have yet to test the overhanging macro resistance:Figure 1: BTC-USD, Daily Candles, Narrow RangeThe blue zone outlined above shows a very strong zone of support that, over the last few weeks, has seen three strong tests and has led to a slowly upward-drifting market consolidation.

2019-3-16 01:56


Фото:

Bitcoin Price Analysis: Keep an Eye Out for a Close Above the Current High

Shortly after falling from its test of the low $4,000s, bitcoin managed to find support in the mid $3,500s. This has proven to be a relevant level over the last few months, and finding support here would be a sign of relatively strong demand:Figure 1: BTC-USD, Daily Candles, Local SupportThe high candle spread rejection following our test of the low $4,000s was an indication that we had strong levels of supply left in the market, but for the time being we are holding support.

2019-3-1 03:44


Фото:

Bitcoin Price Analysis: Bullish Rejection Wipes Out Bitcoin’s Weekend Gains

Over the weekend, a strong rally was stifled by an even stronger rejection as the bitcoin market was shoved into a band of overhanging resistance. This band of resistance has been mentioned several times in our analyses over the last few weeks as it has proven impossible to overcome for the time being:Figure 1: BTC-USD, Daily Candles, Failed BreakoutThis run to the low $4,000s coincided with a breakout of a rather large symmetrical triangle consolidation shown above.

2019-2-26 02:42


Фото:

Bitcoin Price Analysis: Bullish Setups Could Break Current Market Structure

The cryptomarket remains coiled as we lead into the weekend with no new highs and no new lows being established for bitcoin. However, it is nicely consolidating on lower time frames and hints toward the possibility of another leg up:Figure 1: BTC-USD, Hourly Candles, Consolidating PennantThe pattern shown in Figure 1 outlines a potential continuation pattern called a “bullish pennant.

2019-2-23 02:23


Фото:

Bitcoin Price Analysis: After Sudden Upswing, Bitcoin Price Drifts Downward

Last week, we saw a violent move to the upside as bitcoin rallied 11% over the course of one day. Since peaking in the upper $3,600s, bitcoin has seen close to zero bullish follow-through, and the price has begun to drift downward over the course of the last week:Figure 1: BTC-USD, Hourly Candles, Downward DriftDownward-drifting markets like this can often be a sign that distribution is taking place.

2019-2-15 00:21


Фото:

Bitcoin Price Analysis: Strong Move Likely Following Tightly Coiled Market

Days and days of sideways consolidation and tightening volume has been the name of the game for the bitcoin market. A narrow range of $200 has caused a weeks worth of activity to coil and consolidate in preparation for bitcoin’s next move:Figure 1: BTC-USD, Daily Candles, Narrow RangeThe figure above shows just how narrow the range has been over the last week as the market has continued to grind out support and fail to break above overhanging resistance.

2019-1-26 03:13


Ether Price Analysis: Historic Support Tested Amid Signs of Distribution

It’s been weeks since ether has seen a new high or a new low and the market has found itself range-bound. At the moment, we are seeing signs of distribution as large rounds of selling have remained present during key support tests:Figure 1: ETHUSD, 4 Hour Candles, Trading RangeSo far, for the last few weeks, ether has seen a trend of higher lows and low highs (the converging red trendlines).

2018-10-20 01:31