2026-3-16 12:05 |
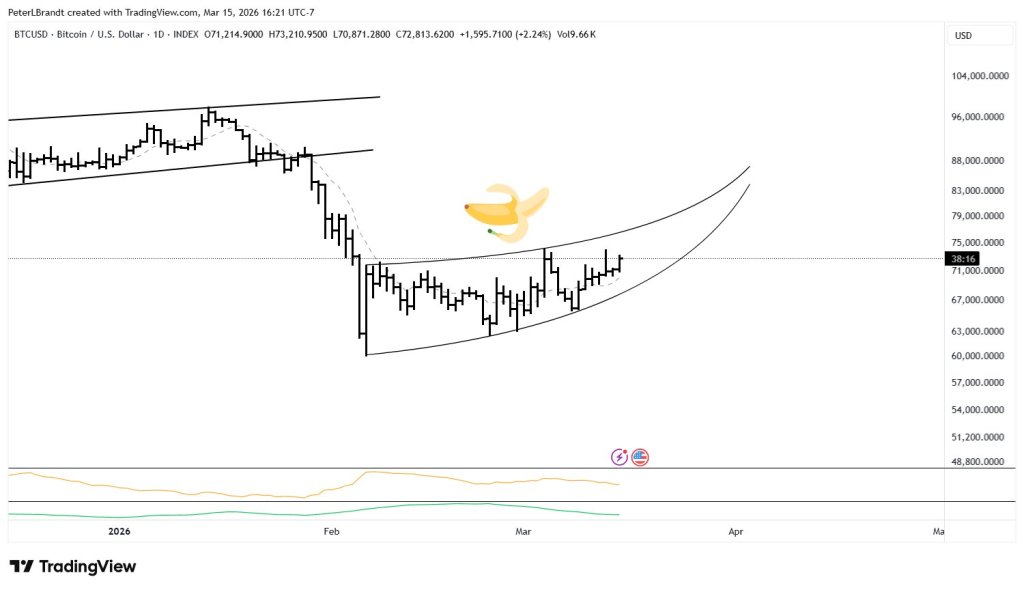
Veteran trader Peter Brandt sparked a fresh round of chart debate around Bitcoin after posting a chart and writing, “The Banana is splitting. This is a Horn. Richard W. Schabacker wrote about this in his 1934 book.” For market participants used to Brandt’s shorthand, the message pointed to a possible shift in how he is reading BTC’s recent recovery structure.
The chart Brandt shared shows Bitcoin on the daily timeframe rebounding from a sharp February washout into the low-$60,000s and climbing back toward the low-$70,000s. The posted candle data showed BTC closing at $72,813.62 on the day, with an intraday high of $73,210.95. Around that rebound, Brandt drew two widening curved boundaries, creating the outline of what he called a “horn.”
‘Banana/Horn’ Could Send Bitcoin Into Mid-$80KsWhat makes the post puzzling is that “banana” is not a standard textbook label in the way flag, wedge or triangle are. In context, Brandt appears to be using it descriptively: the recovery arc looks rounded and elongated, and his comment that “the Banana is splitting” suggests that the smooth curve is beginning to open outward into a broader, more unstable formation. That is where the “horn” reference comes in.
In classical chart language, a horn pattern is best understood as a broadening structure, one where the price path does not tighten but expands. Brandt’s reference to Richard W. Schabacker matters because Schabacker’s pre-war technical analysis work sits near the foundation of modern classical charting. By invoking a 1934 text, Brandt was framing the setup as old-school chart geometry rather than a crypto-native meme or a one-off joke.
The catch is that Brandt himself did not present the pattern as settled. When one user replied, “Dude pick one. Horn or flag,” Brandt answered: “Could be either. Sorry you cannot handle flexibility.” That response is important. It suggests he is not yet making a hard categorical call between a more conventional continuation flag and a widening horn-type formation. Instead, he appears to be highlighting that the structure is in transition and that real-time pattern recognition is rarely as clean as retrospective textbook examples.
Read that way, the tweet is less a precise forecast than a warning about market character. A flag would usually imply a more orderly pause within trend. A horn, by contrast, implies widening swings and a less controlled advance. On Brandt’s chart, Bitcoin is pushing through the upper half of the formation, but the drawn boundaries flare outward as price moves to the right, which visually supports the idea that volatility could expand rather than compress.
As for price target, Brandt did not annotate a measured move, so any projection has to be treated as approximate. The most reasonable read from the image is not a fixed breakout target but a path target along the horn itself. The upper curved boundary rises from around the mid-$70,000 area in mid-March toward roughly $83,000 to $88,000 by early April, while the lower boundary also trends sharply higher. If Bitcoin continues to track the upper side of the pattern, the chart appears to point toward the low- to mid-$80,000s as the next visible zone.
At press time, BTC traded at $73,186.
origin »Bitcoin price in Telegram @btc_price_every_hour
Bitcoin (BTC) на Currencies.ru
|
|