2021-5-18 18:00 |
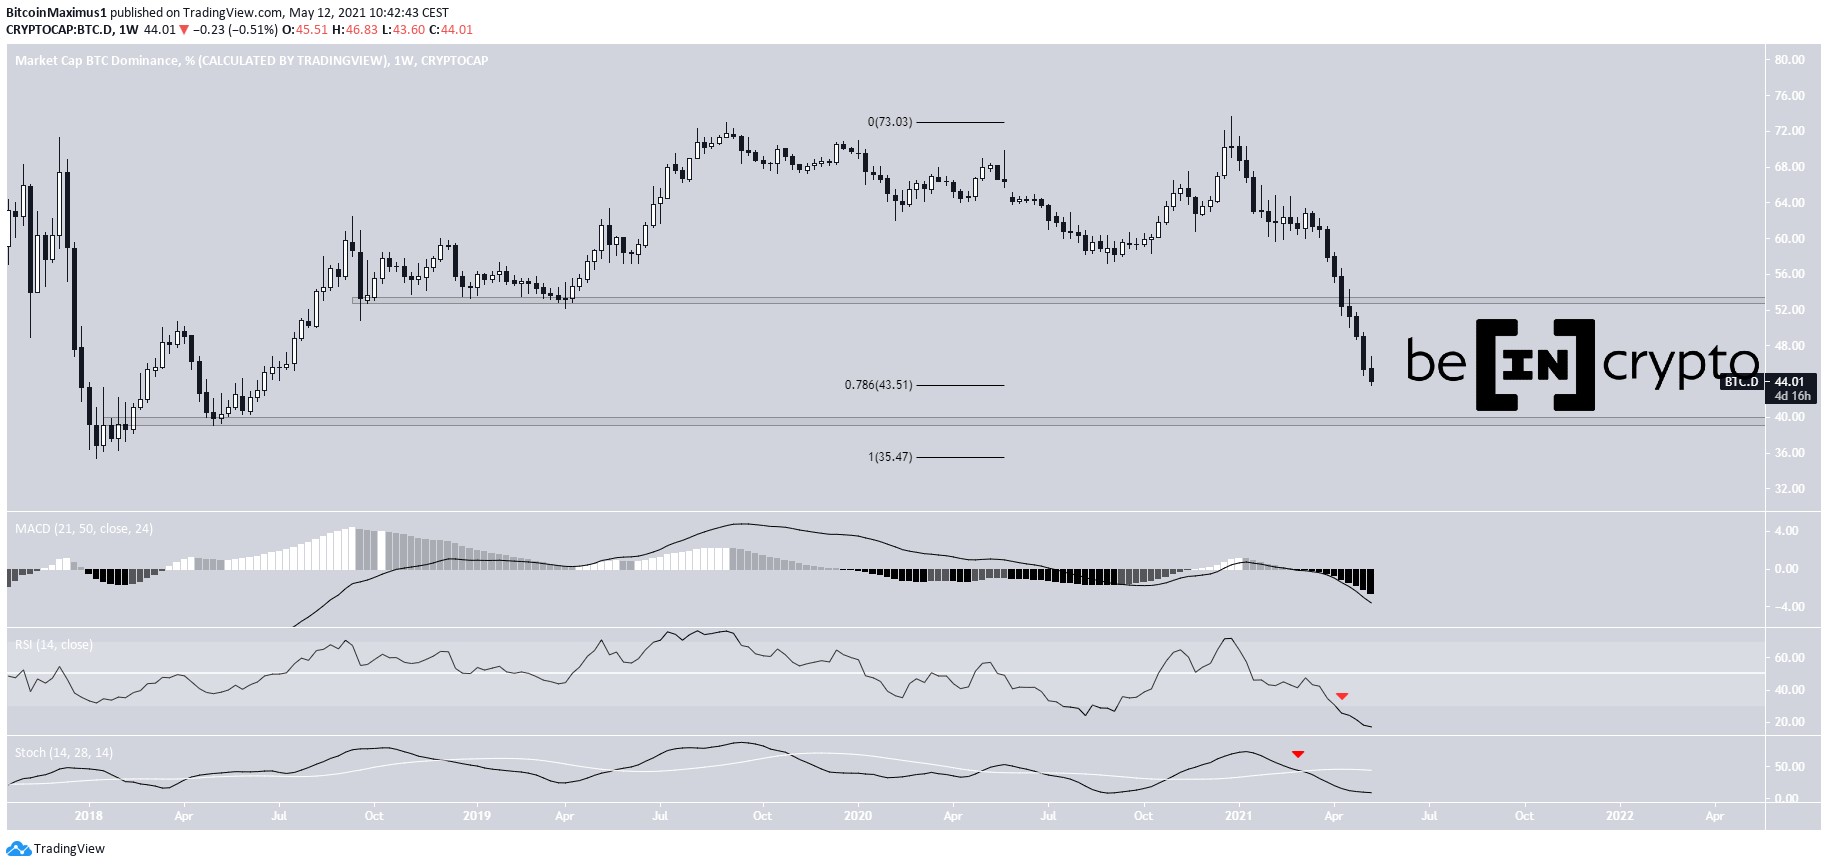
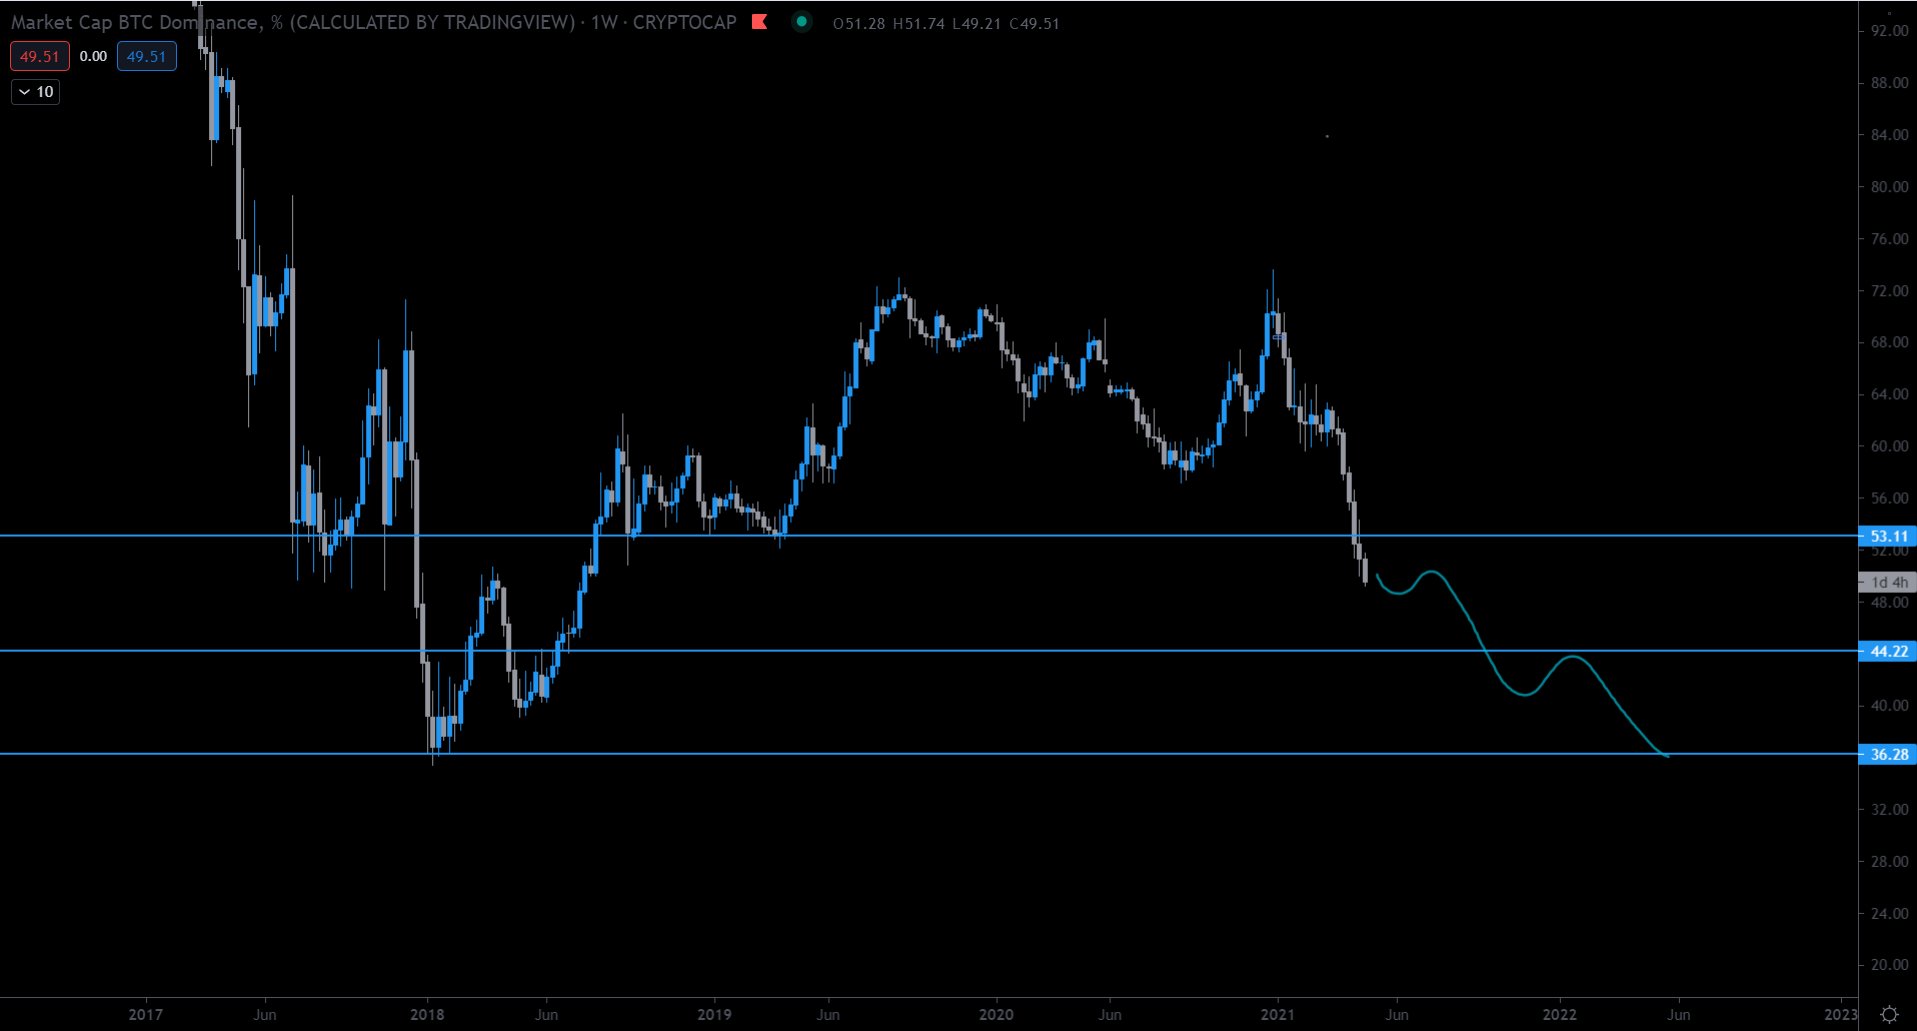
The bitcoin dominance rate (BTCD) has been decreasing throughout the entirety of 2021 and is approaching a long-term support level at 39.5%.
Despite being close to support, BTCD is not showing any bullish reversal signs. Therefore, a continued decrease is likely.
Long-term BTCD decreaseBTCD has been decreasing since December 2020, after it reached a high of 73.63%. So far, it has managed to reach a local low of 40.15% on May 15.
The low was made very close to the long-term 39.50% support area, which has not been reached since 2018. If this support breaks down, the next closest one is found at 36%.
Weekly time-frame indicators are decisively bearish. The RSI has fallen below the 30-line, the MACD is negative, and the Stochastic oscillator has made a bearish cross.
Therefore, it’s likely that the long-term trend is still bearish.
BTCD Chart By TradingView Lack of reversal signs for BTCDThe daily chart does not provide any bullish reversal signs. The MACD and Stochastic oscillator are both close to creating higher momentum bars and bullish crosses but have yet to do so.
In addition, the RSI has invalidated a potential bullish divergence. On the contrary, it created a lower low and is now facing resistance.
BTCD Chart By TradingView Relationship to BTC PriceBTCD (green) is shown alongside the BTC price (orange) in the chart below.
Interestingly, there is no clear relationship between the two. Since April 23, both increases and decrease in the price of BTC have caused a BTCD decrease.
Therefore, regardless of the BTC price movement, BTCD has been falling continuously.
BTCD Chart By TradingView ConclusionBitcoin dominance is expected to decrease to the next support level at 39.5% and could potentially reach 36%. There are no bullish reversal signs showing yet.
For BeInCrypto’s latest bitcoin (BTC) analysis, click here.
The post Bitcoin Dominance (BTCD) Approaches May 2018 Support appeared first on BeInCrypto.
origin »Lendroid Support Token (LST) на Currencies.ru
|
|


