фото показано с : cointelegraph.com
2022-4-16 17:08 |
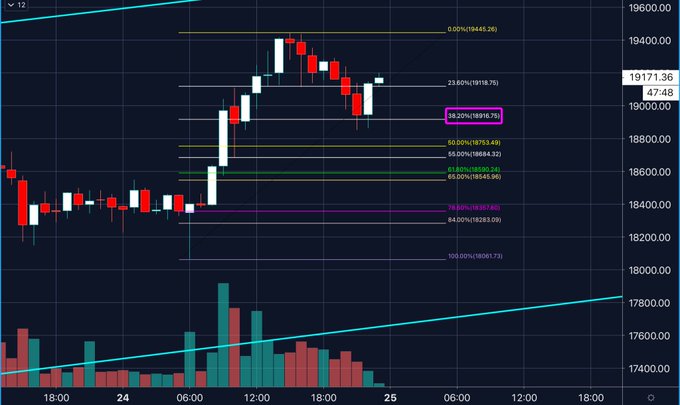
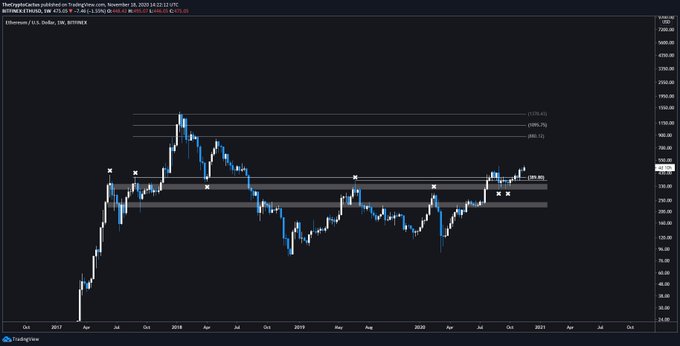
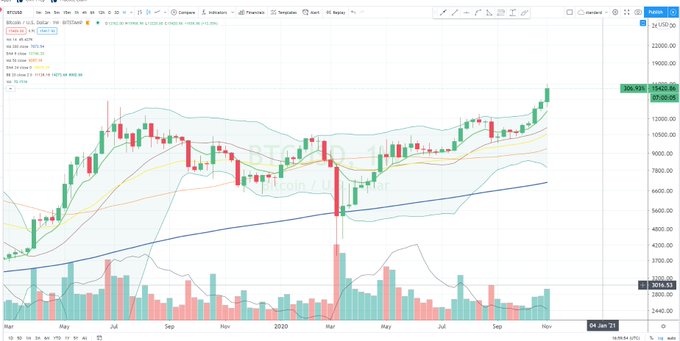
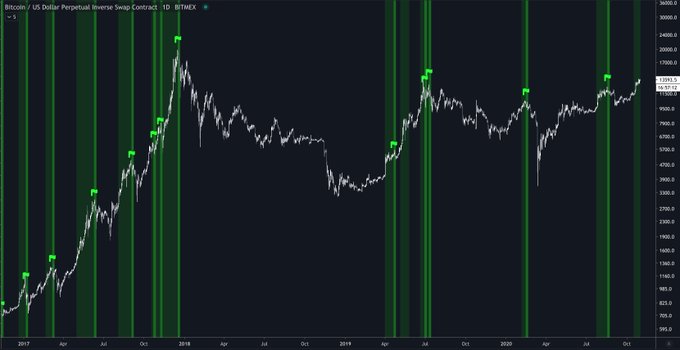
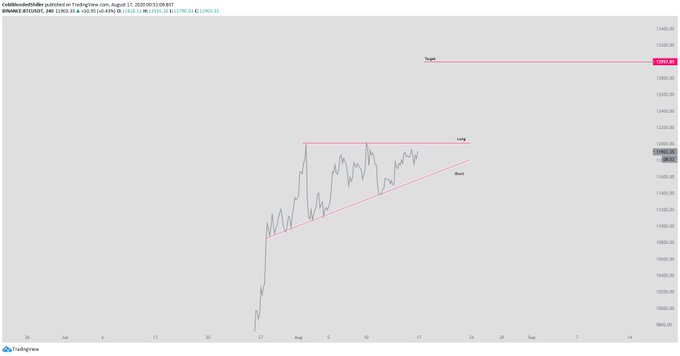
With little comfort on the daily chart, analysts once more zoom out to explain the lack of momentum on the market.
origin »Bitcoin price in Telegram @btc_price_every_hour
ChartEx (CHART) на Currencies.ru
$ 0 (+0.00% )
Объем 24H $0
Изменеия 24h: 0.00 % , 7d: -7.01 %
Cегодня L: $0 - H: $0
Капитализация $0 Rank 99999
Цена в час новости $ 0.0068349 (-100% )
|
|