Bitcoin (BTC) Resumes Consolidation Above and Below $30,000

Bitcoin (BTC) Resumes Consolidation Above and Below $30,000
фото показано с : beincrypto.com

2022-6-4 17:30

Bitcoin (BTC) has failed to sustain a minor support area and risks breaking down from its 22-day consolidation pattern.

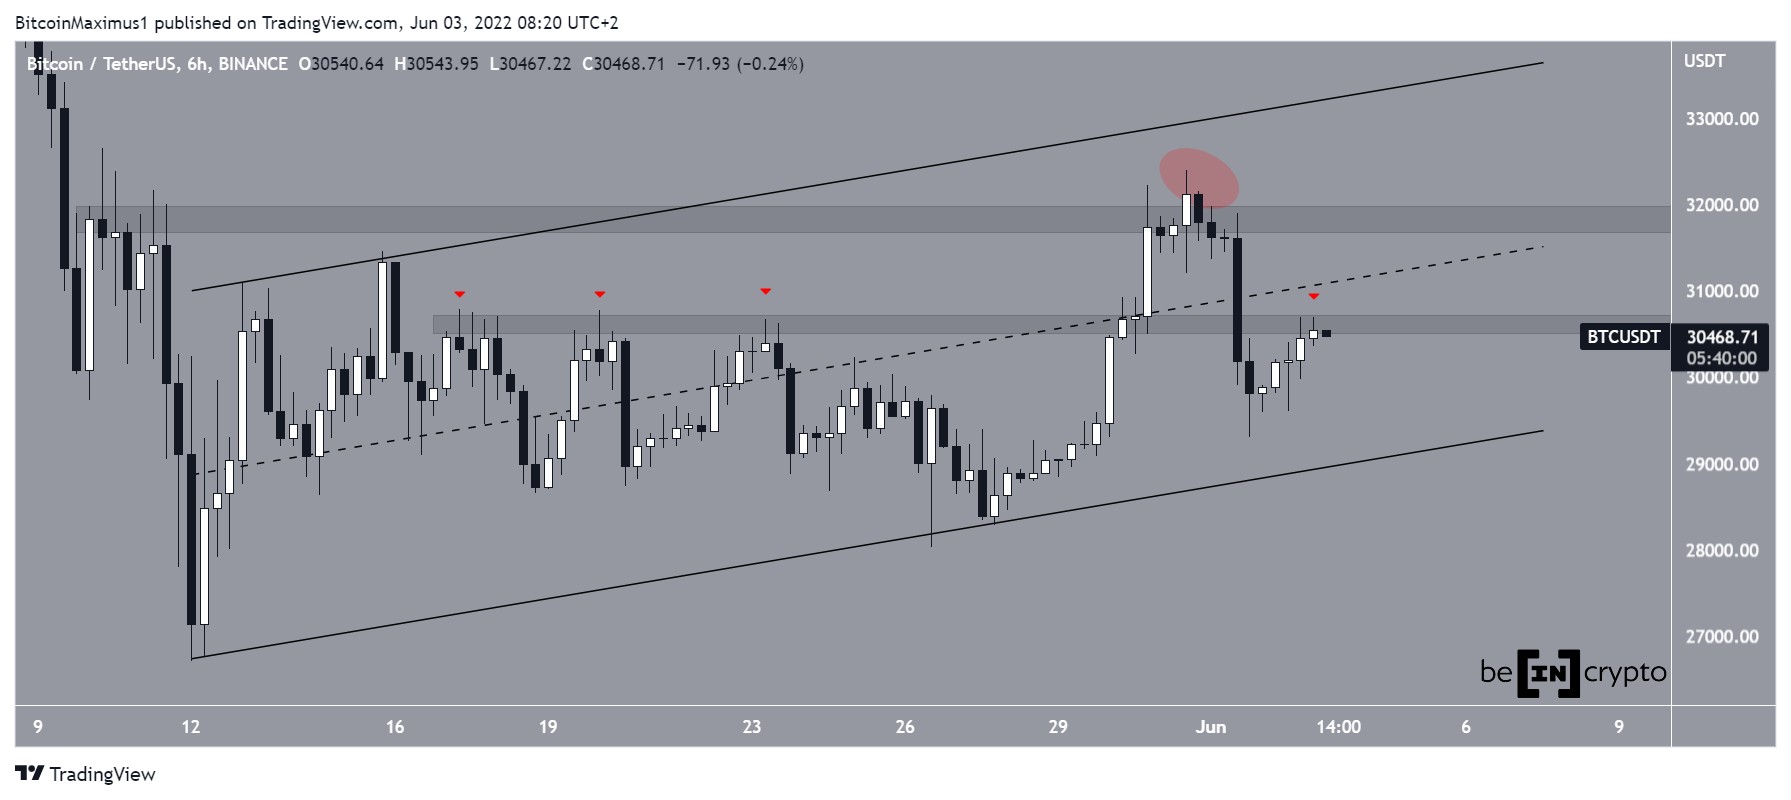
BTC has been increasing inside an ascending parallel channel since May 12. The upward movement led to a high of $32,399 on May 31. Initially, it seemed that this had caused a breakout from the $31,800 horizontal resistance area. However, the price decreased immediately afterwards, rendering the breakout as only a deviation (red circle). 

Additionally, the price fell below the $30,800 area, which was expected to provide support. Now, the area has turned to resistance (red icon). 

So, the six-hour chart for BTC provides a mostly bearish outlook, firstly because the price is trading inside an ascending parallel channel. This is usually considered a corrective pattern.

Secondly, the chart looks bearish because the $30,800 area failed to provide support and turned to resistance instead.

BTC/USDT Chart By TradingView Resistance line

The daily chart shows that BTC has been following a descending resistance line (dashed) since March 2020.  Similarly, the RSI had been following a descending resistance line during the same period. While the RSI did break out, the price has yet to do so. 

Furthermore, the RSI has also generated bullish divergence (green line). But it was rejected by the 50 line (red icon) and has been falling since. 

As a result of these conflicting readings, the daily time frame does not help in confidently determining the direction of the trend.

BTC/USDT Chart By TradingView Wave count analysis

Even though the longer-term wave count is bullish, the short-term count is bearish, supporting the interpretation from the channel.

The most likely count suggests that BTC has completed an A-B-C corrective structure, in which waves A:C had a 1:0.618 ratio. The ongoing decrease that validated the support line of the channel support this possibility.

So a breakdown from the channel would confirm that lower prices are on the horizon.

BTC/USD Chart By TradingView

For Be[in]Crypto’s previous bitcoin (BTC) analysis, click here

The post Bitcoin (BTC) Resumes Consolidation Above and Below $30,000 appeared first on BeInCrypto.

Similar to Notcoin - Blum - Airdrops In 2024

origin »

Bitcoin (BTC) на Currencies.ru

$ 67482.46 (+0.08%)
Объем 24H $11.659b
Изменеия 24h: -0.22 %, 7d: -2.41 %
Cегодня L: $67390.1 - H: $67835.76
Капитализация $1329.844b Rank 1
Цена в час новости $ 29703.93 (127.18%)

consolidation bitcoin btc below above resumes pattern

consolidation bitcoin → Результатов: 126


Фото:

Bitcoin Reaches Critical Level as Bulls Attempt to Spark Fresh Uptrend

Bitcoin’s price has been stuck within a macro consolidation phase for the past several months This consolidation has led to the formation of a trading range between $10,000 and $12,400, with bulls and bears with being unable to break above or below either of these levels One analyst is now noting that data seems to suggest that BTC is currently trading at a pivotal level for its future Although $20,000 is often looked upon as […]

2020-10-19 01:00


Фото:

3 Crucial Reasons Why Bitcoin Could Soon Surge Higher From $8,500

Over the past few days, Bitcoin has finally stabilized after the strong price crash seen on Sunday through Wednesday that took BTC from $10,000 to $8,400. While some analysts fear that this consolidation is a precursor to another leg lower, referencing the fact that assets never trend in a straight line, there’s a case building that this is consolidation is indicative of a bottom.

2020-3-2 02:54


Ether Price Analysis: Historic Support Tested Amid Signs of Distribution

It’s been weeks since ether has seen a new high or a new low and the market has found itself range-bound. At the moment, we are seeing signs of distribution as large rounds of selling have remained present during key support tests:Figure 1: ETHUSD, 4 Hour Candles, Trading RangeSo far, for the last few weeks, ether has seen a trend of higher lows and low highs (the converging red trendlines).

2018-10-20 01:31


Ripple’s Digital Currency XRP Forms Lower High! Set to Return to Downside?

While the market leader Bitcoin has returned to consolidation with low volume trading, the third largest cryptocurrency by market capitalization has been making some significant movements. Ripple’s digital currency had been on a downward spiral since a bearish divergence occurred between price and RSI at the start of October.

2018-10-18 18:44


Bitcoin Cash (BCH) Daily Price Forecast – October 10

  BCH/USD Medium-term Trend: Ranging Supply zones: $800, $900, $1000 Demand zones: $300, $200, $100 BCH still remains in consolidation in its medium-term outlook. $517.70 in the demand area was the low the cryptocurrency attained as the bearish pressure within the range continues before the end of yesterday session. The 4-hour opening candle at $520.50 […]

2018-10-10 21:01