2018-7-30 05:29 |
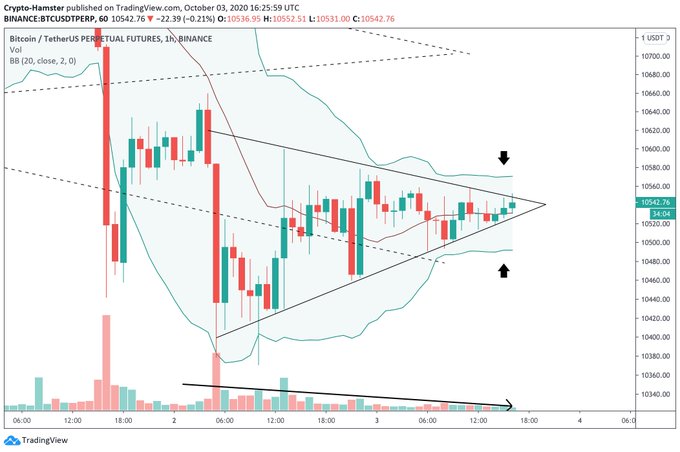
Bitcoin has formed lower highs and higher lows to create a symmetrical triangle consolidation pattern on its short-term charts. Price is approaching the peak of the formation to suggest that a breakout is due soon.
But which direction will it go? The moving averages barely offer strong clues as the technical indicators are simply oscillating to reflect current consolidation. Looking at the earlier trend suggests some bullish momentum may still be present and could be enough to spur continuation past the $8,300 resistance.
The chart pattern spans $7,700 to around $8,500 so the resulting climb could be of the same height. Similarly a break below support at $8,100 could signal a selloff of the same size.
RSI appears to be on the move up but is hovering around the middle of its range. Stochastic is also climbing on this time frame, so bitcoin could follow suit as buyers stay in control. Turning lower from overbought levels, however, could bring sellers back in.
Bitcoin has had a nice solid run in the earlier part of the previous week, boosted by institutional interest and anticipation for bitcoin ETFs. However, the SEC delayed its decision on some and rejected the application from the Winklevoss twins again.
With that, investors are pausing to reevaluate their outlook for the industry, likely waiting for more clues on developments. Another set of positive updates could be enough to revive industry optimism and draw more buyers in while security issues or regulatory threats could lead to profit-taking off the recent rallies.
The US dollar also faces a couple of major catalysts this week, namely the FOMC decision and the NFP report. Hawkish views supported by upbeat data could be strongly bullish for the US currency, which might put some weight on other asset classes like stocks and bitcoin.
The post Bitcoin (BTC) Price Analysis: Heads Up for a Breakout! appeared first on Ethereum World News.
origin »Bitcoin price in Telegram @btc_price_every_hour
Bitcoin (BTC) на Currencies.ru
|
|


