![Bitcoin [BTC] Price Analysis (29/06/18) – Bullish Breakout Possible From Low Volatility Channel](http://blokt.com/wp-content/uploads/2018/06/btc-weekly-chart-1-1024x735.jpg)
2018-6-29 17:24 |
There has been a lot of talk about Bitcoin’s bearish performance this year, with people wondering how long this downtrend can continue. Traders/investors are not helped by a constant stream of different conflicting high-profile opinions:
Jordan Belfort (Wolf of Wall Street) – “Just the beginning of the end.” and “It has the ability to go to zero” ING Bank research – “ownership of cryptocurrencies could more than double in the future” Jack Ma (Alibaba Founder) – “Bitcoin, however, could be a bubble”On top of this, you have a never-ending supply of Bitcoin-related news, about regulations, taxes, technical issues, fees, competitors, mining, etc.
The truth is no one knows for sure where Bitcoins price will be in six months or a years’ time from now. Trying to decipher which news could influence its price and place trades based on that is a difficult task.
However, what we do know is that Bitcoin’s volatility is currently at its lowest level in over a year which could indicate that selling is becoming exhausted. On top of that Bitcoin’s price has been trading within a defined channel pattern for the last two months, which eventually it could have a bullish breakout from, creating potential opportunities for traders.
Let’s take a look at Bitcoin’s chart on multiple time-frames, and analyze this recent price behavior.
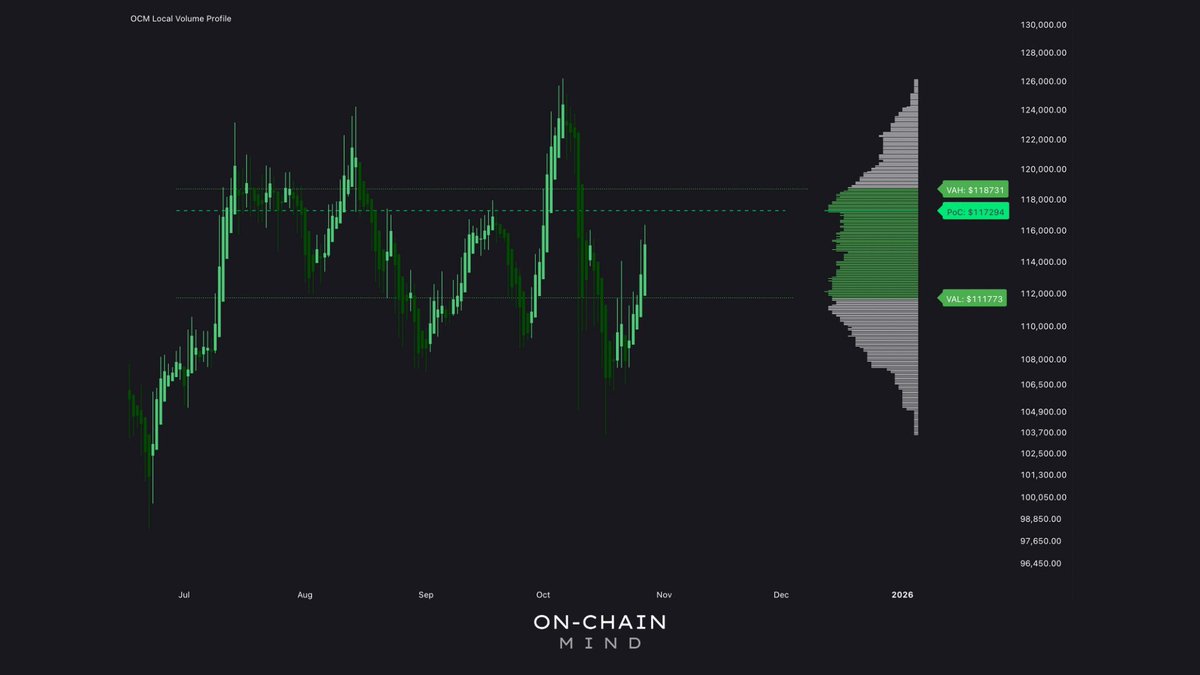
BTC/USD – Weekly ChartWe can see on the weekly chart how Bitcoin’s price behavior has changed over the long term. During 2017 it had an epic move higher, but this didn’t continue in 2018. For the first four months of 2018, the price moved downwards in a very strong a volatile manner. However, over the last few months, the price action has tightened considerably which could indicate selling is becoming exhausted, at least temporarily.
BTC/USD – Daily ChartThe daily chart shows clearly this year’s price action which has gone from very volatile to now trading within a defined channel pattern. It’s this sloping channel pattern that is worth watching for a potential breakout to the upside. It’s possible that price will continue trading within this pattern a while longer, and while it does the potential trade opportunity remains the same. A break of the upper trendline at any point would signal a breakout.
It’s worth noting that the price is currently below three major simple moving averages (50, 100 and 200 day.) If we do see a breakout to the upside, these could become potential areas of resistance to watch or profit targets.
BTC/USD – 4-Hour ChartWe can clearly see the sloping channel pattern on the 4-hour chart and how price has continuously bounced from side to side within it but failed to breakout so far. If we do see a breakout, the 4-hour chart allows you to see where the short-term areas of resistance may be, based on previous levels of support/resistance. These could be also used as profit targets for short-term traders.
Key areas to watch: Channel pattern – Watch for the price to breakout above the upper trendline. Moving Averages – Watch the key MA’s on the daily chart for potential areas of resistance after a breakout. 4-hour Chart – Allows you to see initial areas of potential resistance after a breakout. They can also be used as profit targets. DISCLAIMER: Investing or trading in digital assets, such as those featured here, is extremely speculative and carries substantial risk. This analysis should not be considered investment advice, use it for informational purposes only. Historical performance of the assets discussed is not indicative of future performance. Statements, analysis, and information on blokt and associated or linked sites do not necessarily match the opinion of blokt. This analysis should not be interpreted as advice to buy, sell or hold and should not be taken as an endorsement or recommendation of a particular asset.Bitcoin [BTC] Price Analysis (29/06/18) – Bullish Breakout Possible From Low Volatility Channel was originally found on [blokt] - Blockchain, Bitcoin & Cryptocurrency News.
origin »Bitcoin price in Telegram @btc_price_every_hour
Bitcoin (BTC) на Currencies.ru
|
|