2018-12-28 12:44 |
Bitcoin Weekly Logarithmic Chart – Source: Tradingview.com
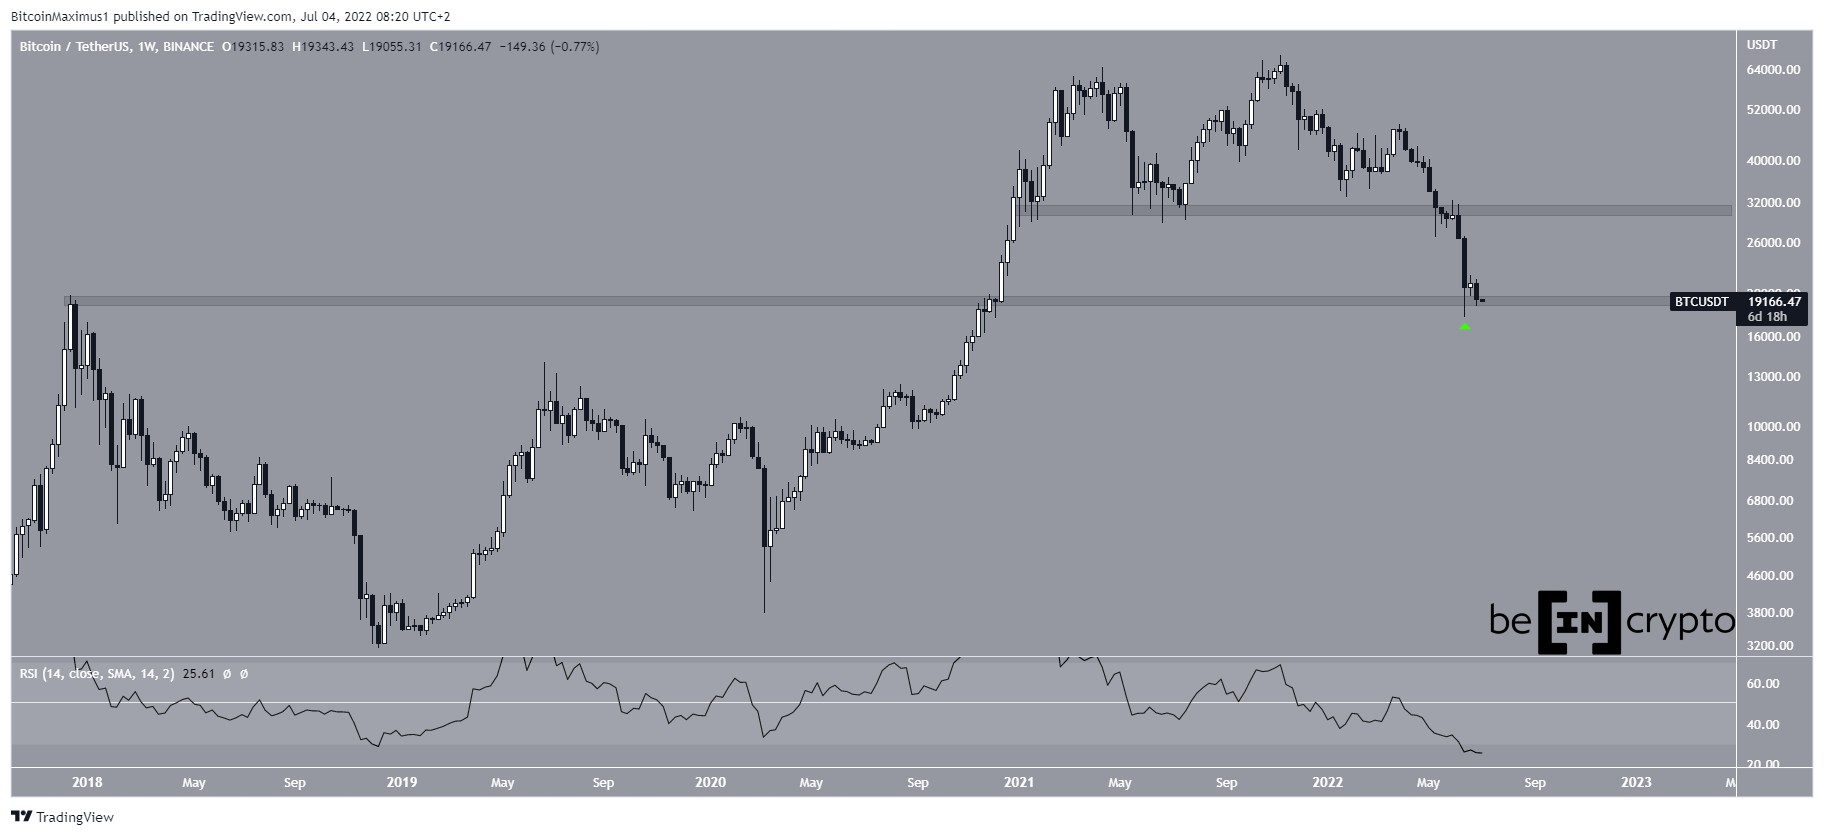
A look at the chart for Bitcoin in logarithmic form shows that price fell to the first support area at $3000 and a quick reversal ensued.
Price is now trading at $3700. If the support area does not hold, the second one will be at $1900-$2000.
The main support area formed by the highs of 2014 will be found at $900-$1100.
Long-Term Outlook Bitcoin Weekly Chart – Source: Tradingview.comStaying with the Weekly chart, a closer look at the indicators shows that price fell right to the 200-period moving average and found support.
However, the price is facing resistance from the 7,21 and 50 period MAs and multiple bearish crosses have occurred. The RSI is <30 without any divergence.
Medium-Term Outlook Bitcoin 3-Day Chart – Source: Tradingview.comA look at the 3-day chart shows that there is a bullish divergence between the price and RSI.
Furthermore, the MACD made a bullish cross and is seemingly headed upward.
However, price faces resistance from all the moving averages, and multiple bearish crosses have occurred.
Short-Term Outlook Bitcoin Daily Chart – Source: Tradingview.comA look at the Daily chart shows that there has been a significant bullish divergence between price and RSI.
Furthermore, the MACD seems to have stagnated with decreasing volume.
A potential head and shoulders pattern is in play, with the solid red line serving as the neckline. Resistance fib lines from the fall are presented in the graph.
Bitcoin 2-Hour Chart – Source: Tradingview.comLooking at the potential head and shoulder pattern in a shorter, 2-hour timeframe shows that price formed a descending wedge during the formation of the wedge, and then broke out.
Currently, the price is at the first support area, while the second one will be at $3300-$3400.
Conclusions: Price has found support at the 200-Week Moving Average. Multiple bearish crosses have occurred. Potential head and shoulder in play. DISCLAIMER: Investing or trading in digital assets, such as those featured here, is extremely speculative and carries substantial risk. This analysis should not be considered investment advice, use it for informational purposes only. Historical performance of the assets discussed is not indicative of future performance. Statements, analysis, and information on blokt and associated or linked sites do not necessarily match the opinion of blokt. This analysis should not be interpreted as advice to buy, sell or hold and should not be taken as an endorsement or recommendation of a particular asset.Bitcoin [BTC]: Moving Averages Offering Support, Head and Shoulders in Play? was originally found on [blokt] - Blockchain, Bitcoin & Cryptocurrency News.
origin »Bitcoin price in Telegram @btc_price_every_hour
Lendroid Support Token (LST) на Currencies.ru
|
|
