2021-12-24 12:00 |
Bitcoin (BTC) has moved above its short-term corrective pattern and appears to be heading for the closest resistance area at $55,500.
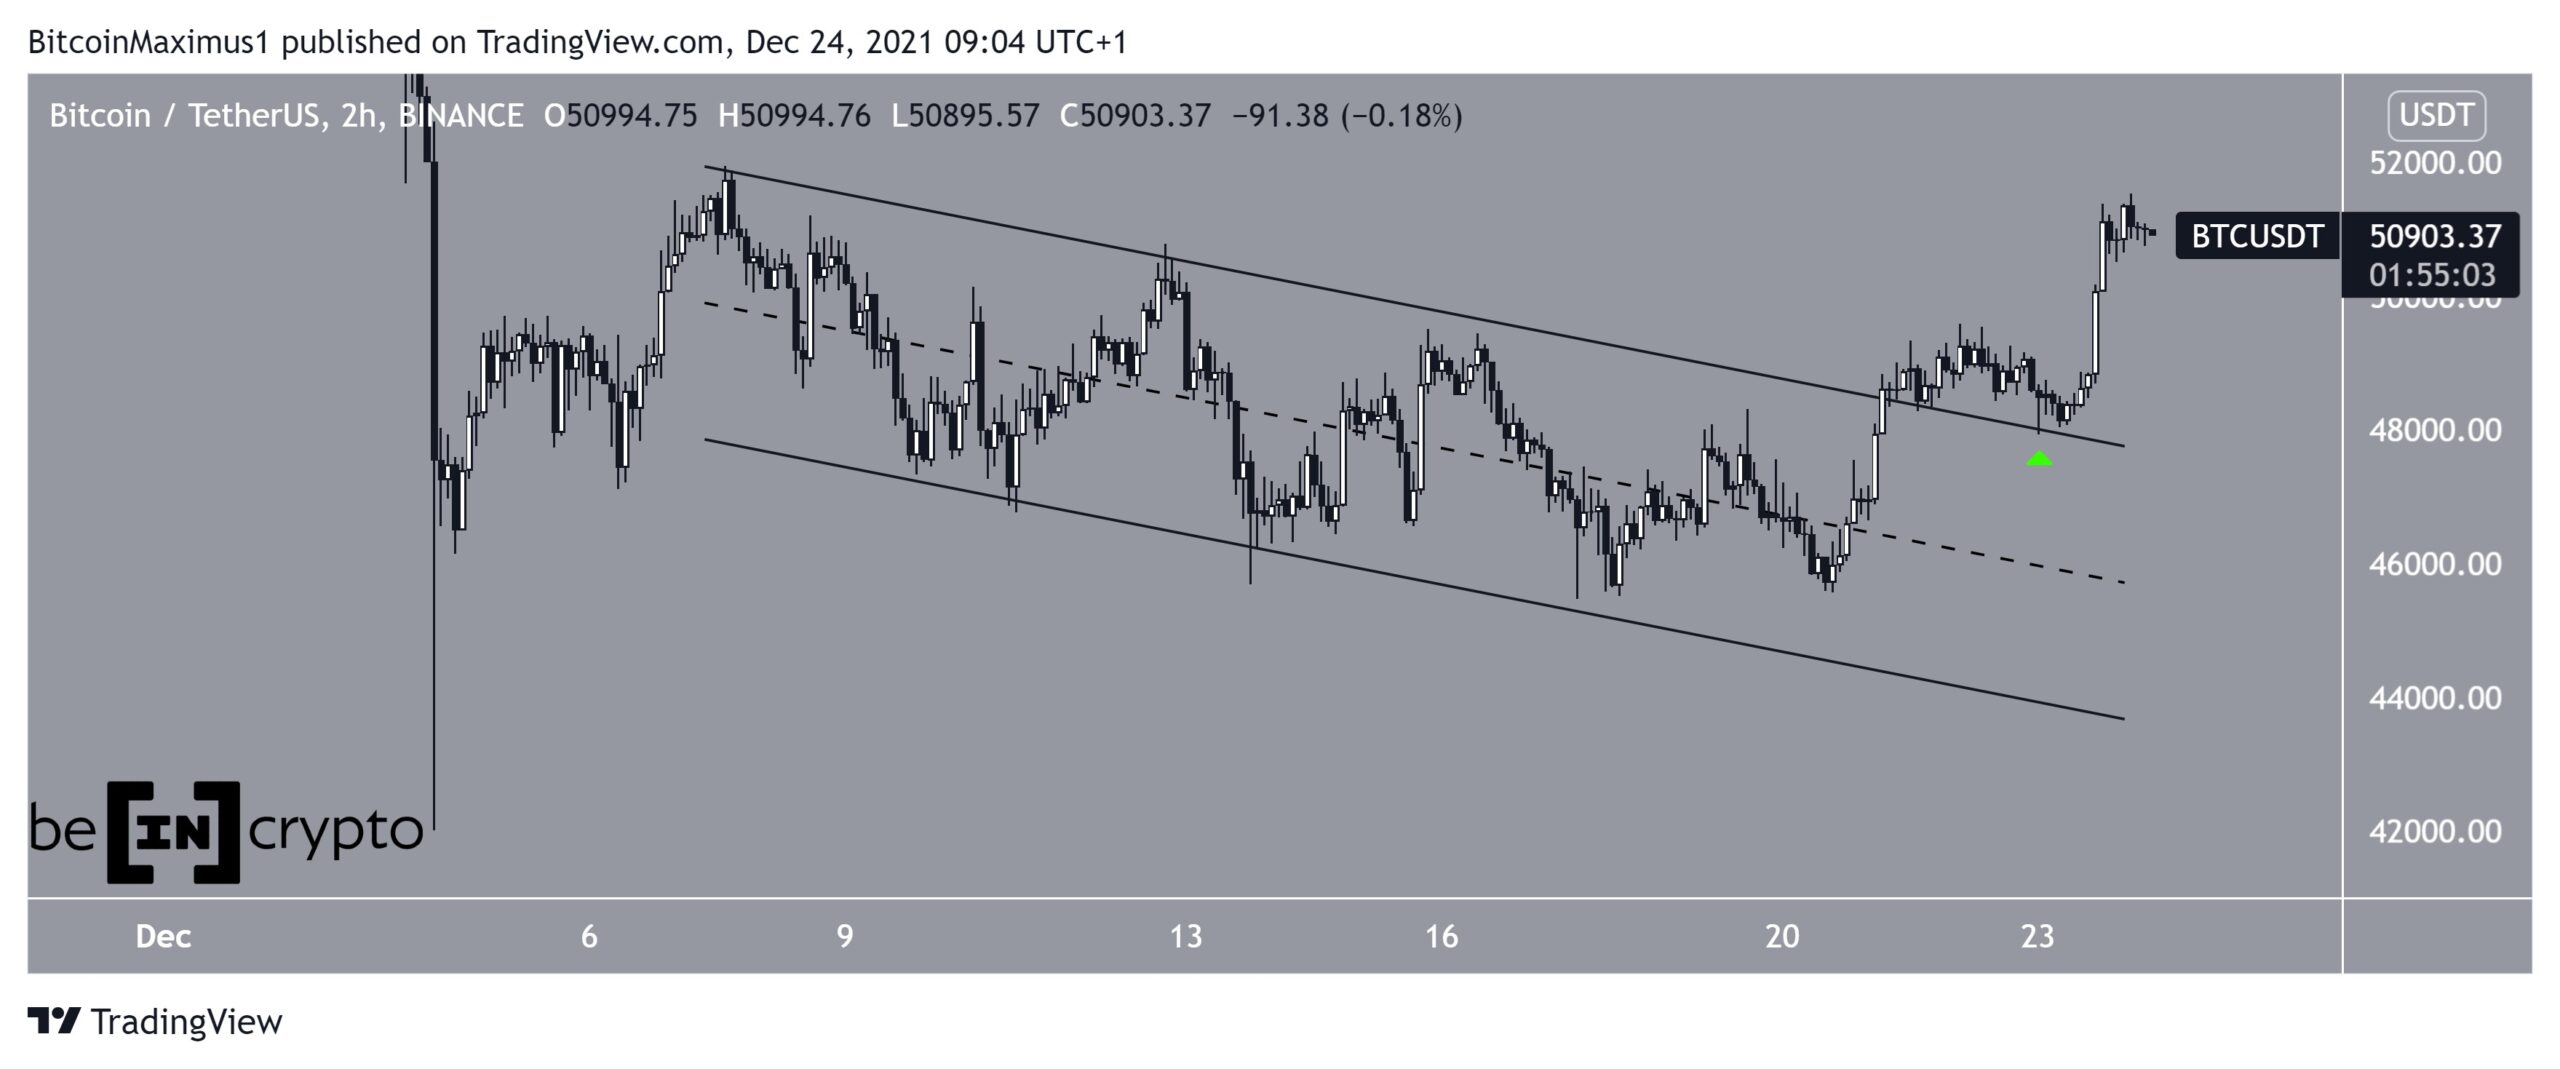
In the period between Dec 7 and 21, BTC decreased inside a descending parallel channel. On Dec 21, it managed to break out and initiated the current upward movement. This confirmed that the short-term correction is complete.
Two days later, it validated the resistance line of the channel as support (green icon) and resumed the upward move at an accelerated rate.
So far, it has reached a high of $50,950 on Dec 24.
BTC Chart By TradingView Future BTC movementThe six-hour chart shows that BTC is potentially trading inside another channel, this time an ascending one.
Currently, it’s attempting to reclaim the midline of this channel. If successful in doing it, a movement towards the resistance line would be expected.
The resistance line of the channel coincides with the 0.5 Fib retracement resistance level at $55,500, strengthening its significance.
BTC Chart By TradingView Weekly movementAn interesting development is the potential bullish engulfing candlestick that is transpiring in the weekly time frame. This is a type of bullish candlestick in which the entire previous decrease is negated inside one candlestick.
The previous two times this occurred, the price rallied by 81% and 73%.
If BTC completes this bullish candlestick, it could potentially rally in a similar way.
BTC Chart By TradingViewFor BeInCrypto’s previous latest Bitcoin (BTC) analysis, click here
The post Bitcoin (BTC) Moves Back Above $50,000 After December Downtrend appeared first on BeInCrypto.
origin »Bitcoin price in Telegram @btc_price_every_hour
Bitcoin (BTC) на Currencies.ru
|
|


