2022-6-15 12:00 |
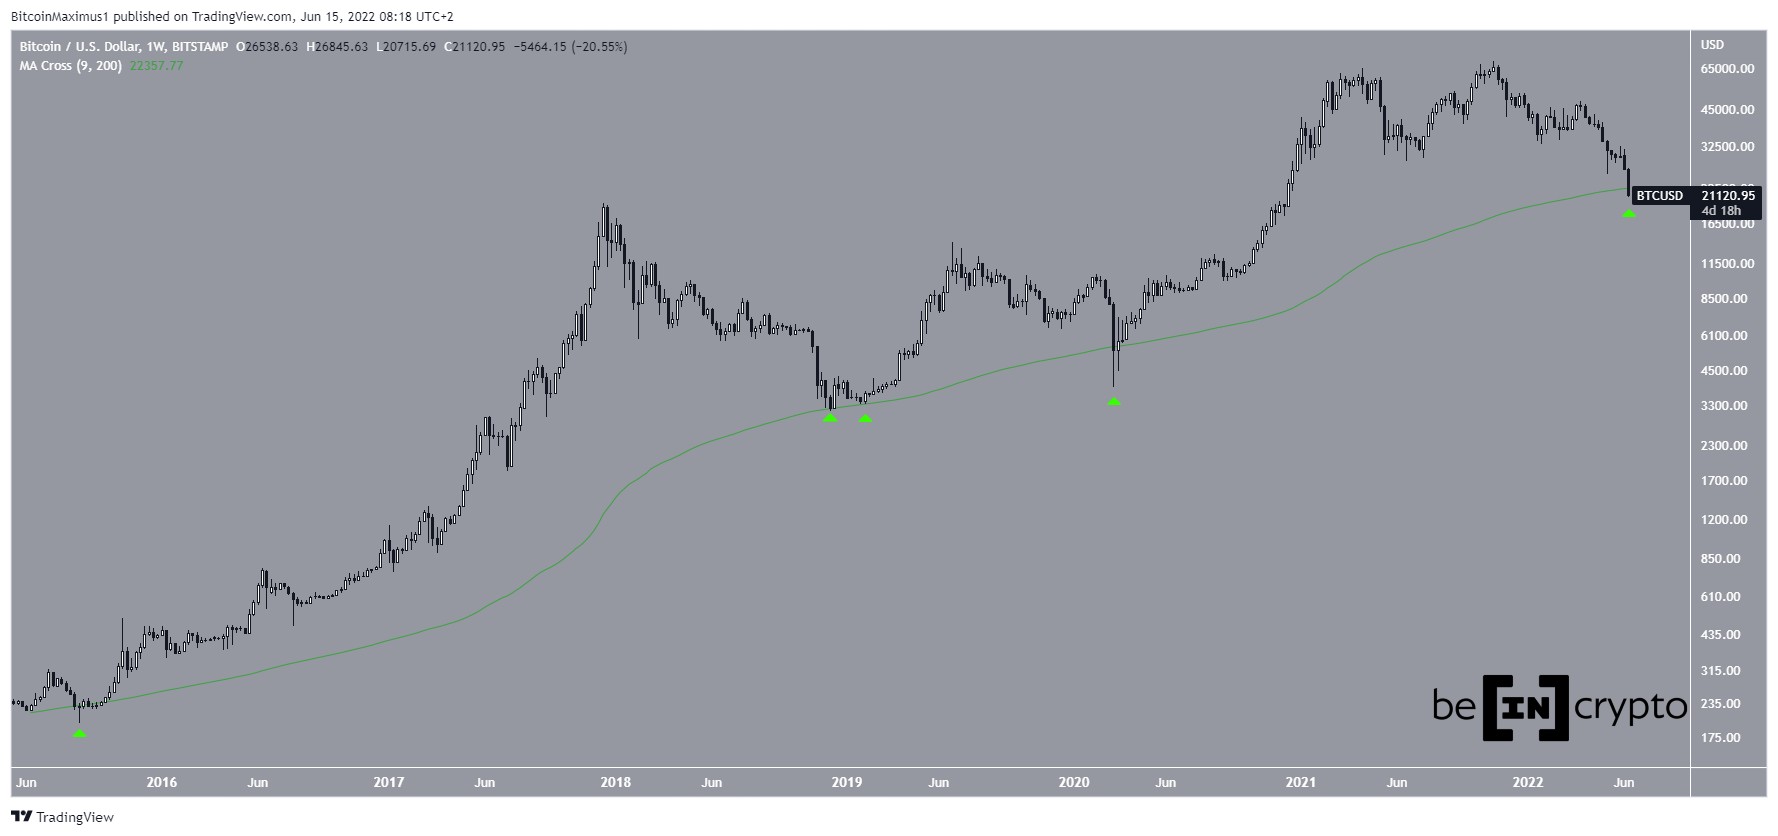
Bitcoin (BTC) has dropped to a crucial long-term moving average (MA), below which it has never reached a weekly close.
BTC has been falling since reaching an all-time high price of $69,000 in Nov. The downward movement has so far led to a low of $20,715 on June 15.
An interesting development is the fact that the price has reached its 200-day moving average (MA). This is the fifth time (green icons) it has done so since the beginning of its price history.
Interestingly, the price has never reached a weekly close below this level. While it decreased below it in March 2020, it bounced and created a long lower wick, reclaiming the line shortly afterwards.
BTC/USD Chart By TradingView Short-term double bottomThe daily chart does not show any reversal signs, since the price has been free falling without a sign of a bottom.
However, the daily RSI is the lowest it has been since Jan (green icons). At the time, an upward movement of 46% followed.
BTC/USDT Chart By TradingViewThe 30-minute chart shows that the price has created a double bottom at $21,000 relative to the price on June 14.
Furthermore, it has bounced at the support line of a descending parallel channel. Such channels usually contain corrective movements, meaning that an eventual breakout from it would be expected.
If one occurs, the closest resistance area would be at $22,800.
BTC/USDT Chart By TradingView BTC wave count analysisThe short-term wave count shows that BTC might have completed a five-wave downward movement (black).
The current low has been made at a confluence of Fib levels between $21,850 and $22,650. These are given by the 1.61 external Fib retracement of wave four (black) and the length of wave one (white).
So, it is possible that a bottom has been made.
BTC/USD Chart By TradingViewAdditionally, if the entire downward movement since the all-time high is an A-B-C corrective structure (red), then waves A:C have had an exactly 1:1 ratio when using the Fib chart.
So, this supports the findings from the weekly time frame and those from the short-term count that suggest a bottom has been reached or is very close.
BTC/USD Chart By TradingViewFor Be[in]Crypto’s latest bitcoin (BTC) analysis, click here
The post Bitcoin (BTC) Falls to 200-Week MA for Fifth Time in History appeared first on BeInCrypto.
origin »Bitcoin price in Telegram @btc_price_every_hour
Bitcoin (BTC) на Currencies.ru
|
|