2022-6-23 11:45 |
Bitcoin (BTC) has made three attempts at breaking out from a descending resistance line. After bouncing at a short-term support level, it is making another attempt at breaking out.
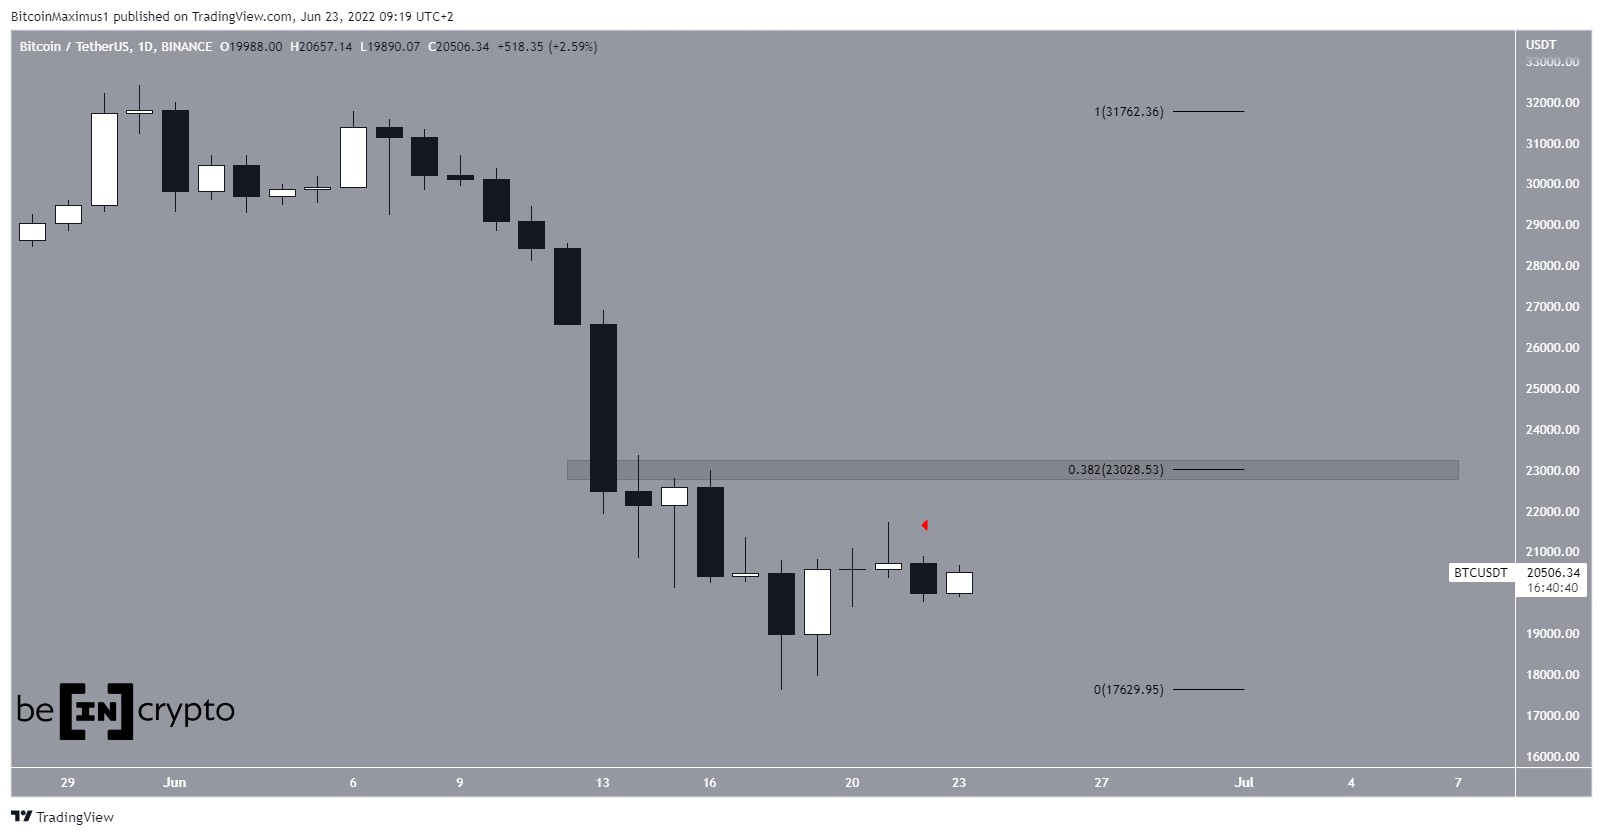
BTC has been increasing since reaching a low of $17,622 on June 18. The next day, it created a bullish engulfing candlestick and proceeded to reach a high of $21,723 on June 21.
While this created a long upper wick (red icon) and a retracement, the price seemingly began another upward movement on June 23.
If the increase continues, the closest resistance would be at $23,000. This is the 0.382 Fib retracement resistance level and also a horizontal resistance area.
BTC/USDT Chart By TradingView Short-term movementThe six-hour chart is more bullish than the daily, since it shows that the six-hour RSI has generated bullish divergence. Afterward, it moved above the high of the divergences, granting more legitimacy to the divergence.
The price is also following a descending resistance line and has so far made three breakout attempts.
A breakout from the resistance line would also cause a RSI movement above 50, confirming the reversal and taking the price towards $23,000.
BTC/USDT Chart By TradingViewThe two-hour chart shows that the price has bounced at the 0.5 Fib retracement level at $19,700 (green circle) and is in the process of making its first higher low.
BTC/USDT Chart By TradingView BTC wave count analysisThe ongoing increase since June 18 is a five wave structure (black). While it is not yet certain if it is part of an A-B-C structure or new bullish reversal, another upward movement would be expected.
The long-term wave count also indicates that a bottom is close, supporting the possibility that the increase is a new bullish impulse rather than it being an A-B-C structure.
BTC/USD Chart By TradingViewFor Be[in]Crypto’s previous bitcoin (BTC) analysis, click here
The post Bitcoin (BTC) Creates Temporary Higher Low At $19,700 appeared first on BeInCrypto.
origin »Bitcoin price in Telegram @btc_price_every_hour
Bitcoin (BTC) на Currencies.ru
|
|


