2021-11-24 11:53 |
Bitcoin (BTC) has completed a double bottom pattern and could soon confirm it with a strong bounce towards resistance.
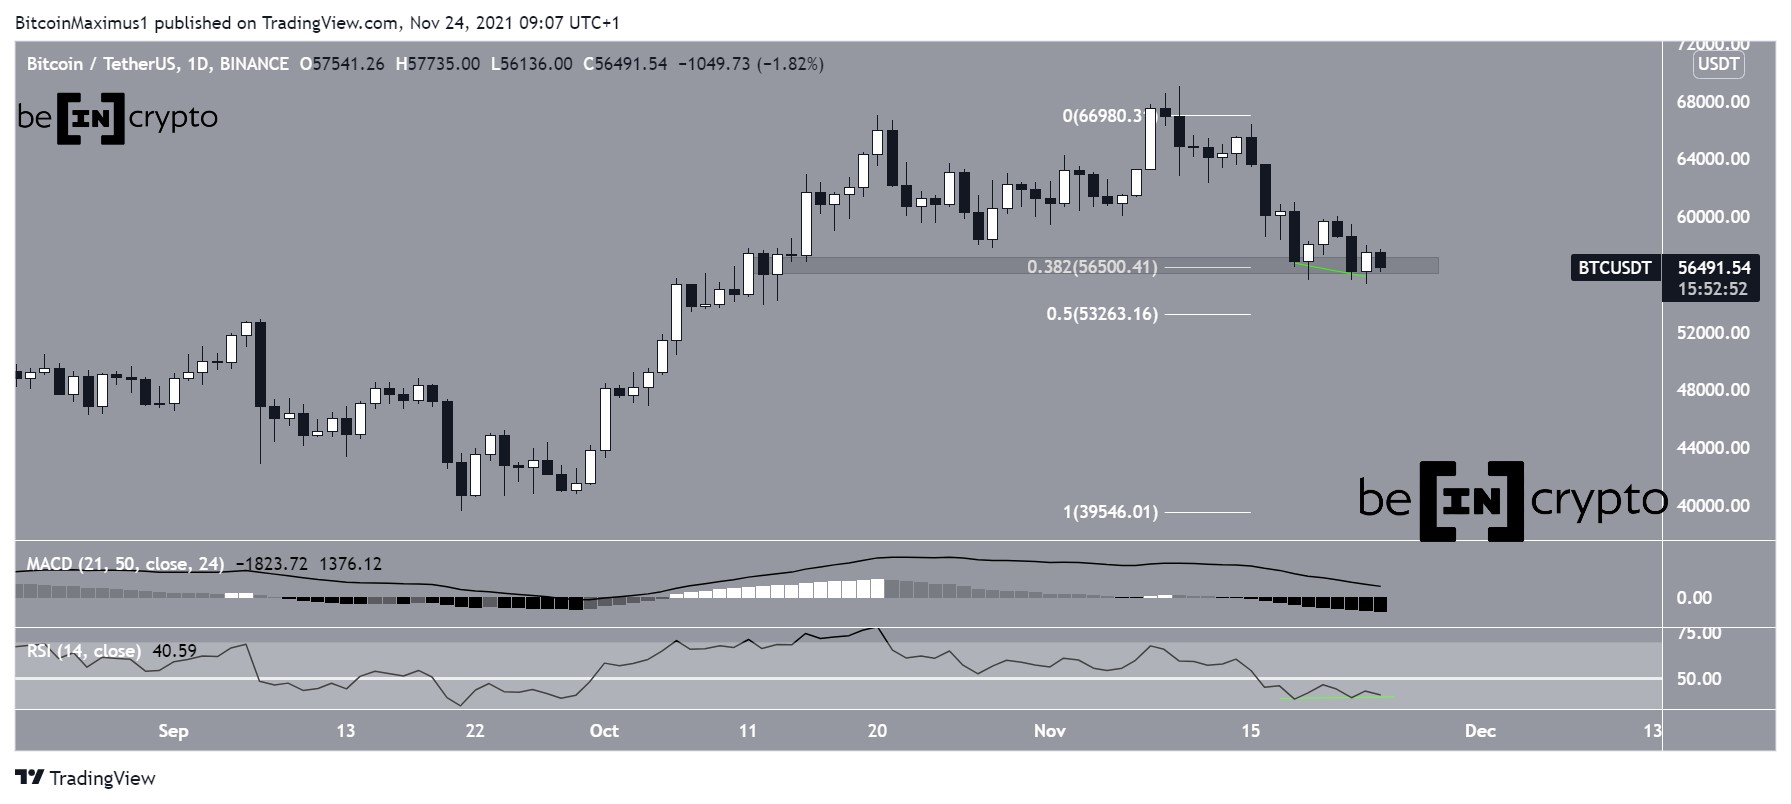
BTC has been falling since reaching an all-time high price of $69,000 on Nov 10. So far, the decrease has led to a low of $55,317, which was reached on Nov 23.
Currently, BTC is trading just above the $56,500 support area. This is both a horizontal support area and the 0.382 Fib retracement support level (white).
Inside it, BTC has created a double bottom, which is often considered a bullish pattern. Furthermore, the pattern has been combined with a bullish divergence in the RSI (green), which often precedes trend reversals.
However, besides the bullish divergence, the other readings from both the RSI and MACD are bearish.
The MACD is falling and is nearly negative. This means that the short-term trend is decelerating relative to the long-term one, and is considered a bearish sign. The RSI is also falling and is below 50, a reading which is associated with bearish trends.
BTC Chart By TradingView Short-term BTC movementThe readings from the six-hour chart align with those from the daily. There is even a more pronounced bullish divergence, also visible in the MACD. This further solidifies the possibility that the pattern will play out.
There is strong resistance at $60,700, created by:
A horizontal resistance areaThe 0.382 Fib retracement resistance levelA descending resistance lineA breakout above this line would confirm that the correction is complete.
BTC Chart By TradingView Wave countThe wave count suggests that BTC has completed an A-B-C corrective structure (red), in which waves A:C have had a 1:1.61 ratio. This is very common in such structures.
Once the correction is complete, BTC would be expected to resume its upward move, since the trend is still likely to be bullish.
The long-term wave count (black) is also bullish, showing that that BTC is inside a large 1-2/1-2 wave formation.
BTC Chart By TradingViewFor BeInCrypto’s previous Bitcoin (BTC) analysis, click here.
The post Bitcoin (BTC) Creates Bullish Pattern Inside Support Range appeared first on BeInCrypto.
origin »Bitcoin price in Telegram @btc_price_every_hour
Bitcoin (BTC) на Currencies.ru
|
|


