2021-12-3 12:35 |
Bitcoin (BTC) looks to be gearing up for another breakout attempt above short-term resistance. If successful, it would confirm that the current correction is complete.
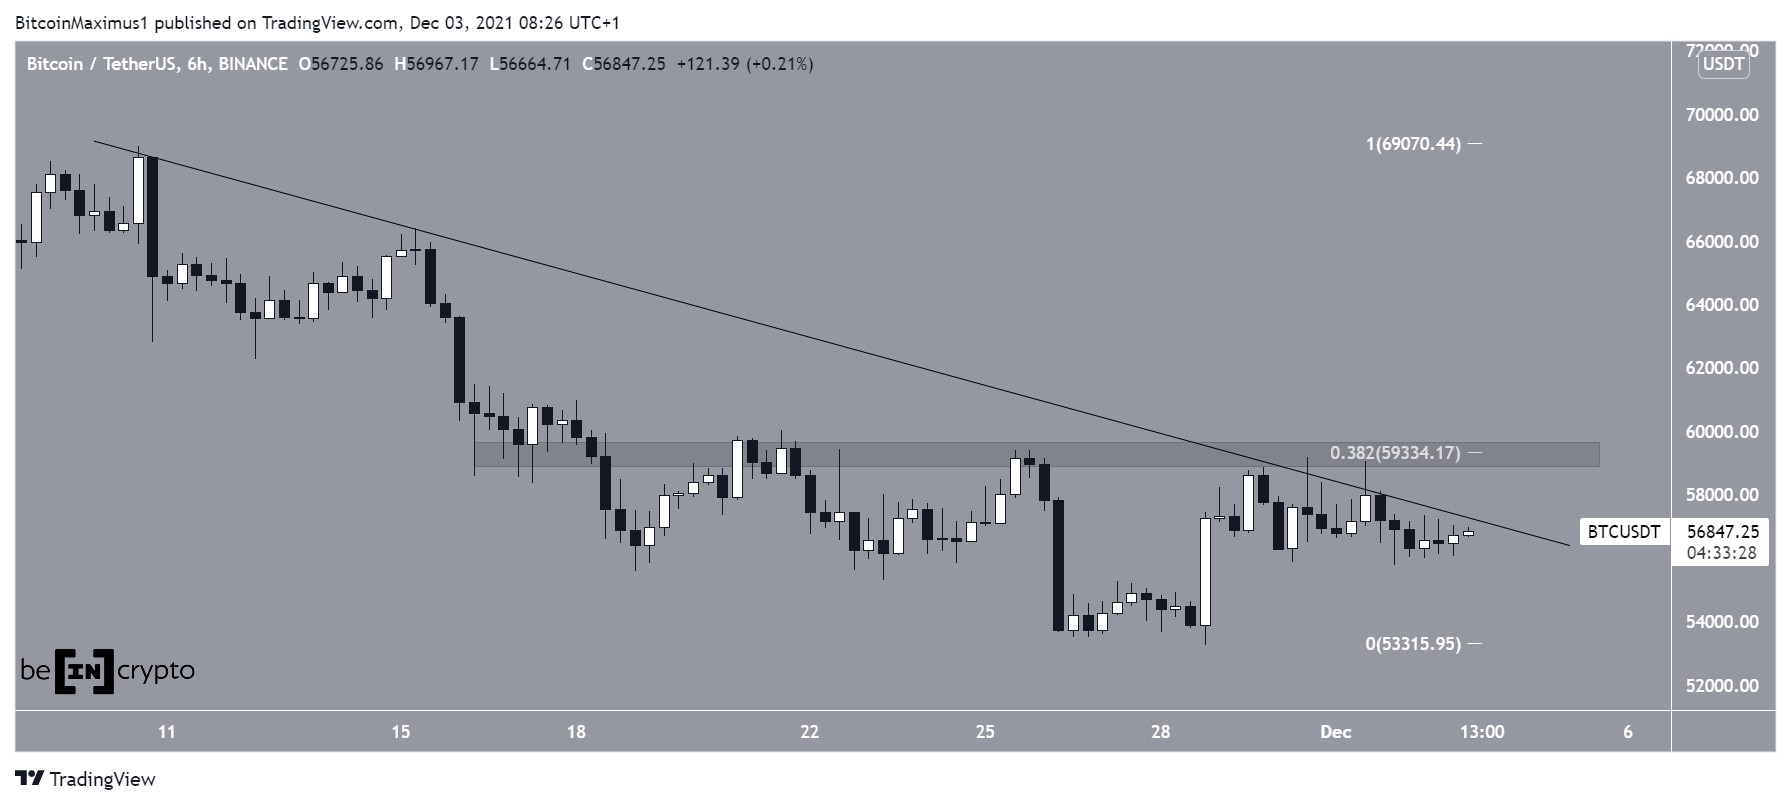
BTC has been decreasing underneath a descending resistance line since Nov 10 after it had just reached a new all-time high price of $69,000. So far, it has reached a local low of $53,256 on Nov 28. It rebounded after reaching this low and has been increasing since.
The main resistance area is found near $59,350, created by both a horizontal resistance and the 0.382 Fib retracement resistance level. Furthermore, it coincides with the previously outlined descending resistance line that rejected BTC twice, on Nov 30 and Dec 1.
As long as the price is trading below this resistance line, a bullish trend reversal cannot yet be confirmed. A breakout above this line would confirm that the correction is complete.
BTC Chart By TradingViewThe 30-minute chart shows a horizontal and 0.5 support located at $56,250.
As long as BTC is trading above this level, the potential short-term bullish structure remains intact and another eventual breakout attempt is likely.
BTC Chart By TradingView Long-term BTC movementThe daily BTC chart is still bullish, mostly because of the bullish candlestick that was created on Nov 28.
Firstly, the candlestick validated the $53,350 area as long-term support. This is both a horizontal support level and the 0.5 Fib retracement support.
Secondly, despite the short-term decrease, the price is still contained inside the body of that bullish candlestick. As seen in the 30-minute chart, BTC is still above the midline of the candlestick.
As long as it is trading above these levels, the trend can still be considered bullish.
BTC Chart By TradingViewFor BeInCrypto’s previous Bitcoin (BTC) analysis, click here.
The post Bitcoin (BTC) Continues Consolidating Below Major Resistance appeared first on BeInCrypto.
origin »Bitcoin price in Telegram @btc_price_every_hour
Bitcoin (BTC) на Currencies.ru
|
|


