2021-6-2 10:41 |
Bitcoin (BTC) has been trading inside a symmetrical triangle since reaching a local low daily close on May 30.
It’s approaching the convergence point between resistance and support, at which time a decisive movement is likely to occur.
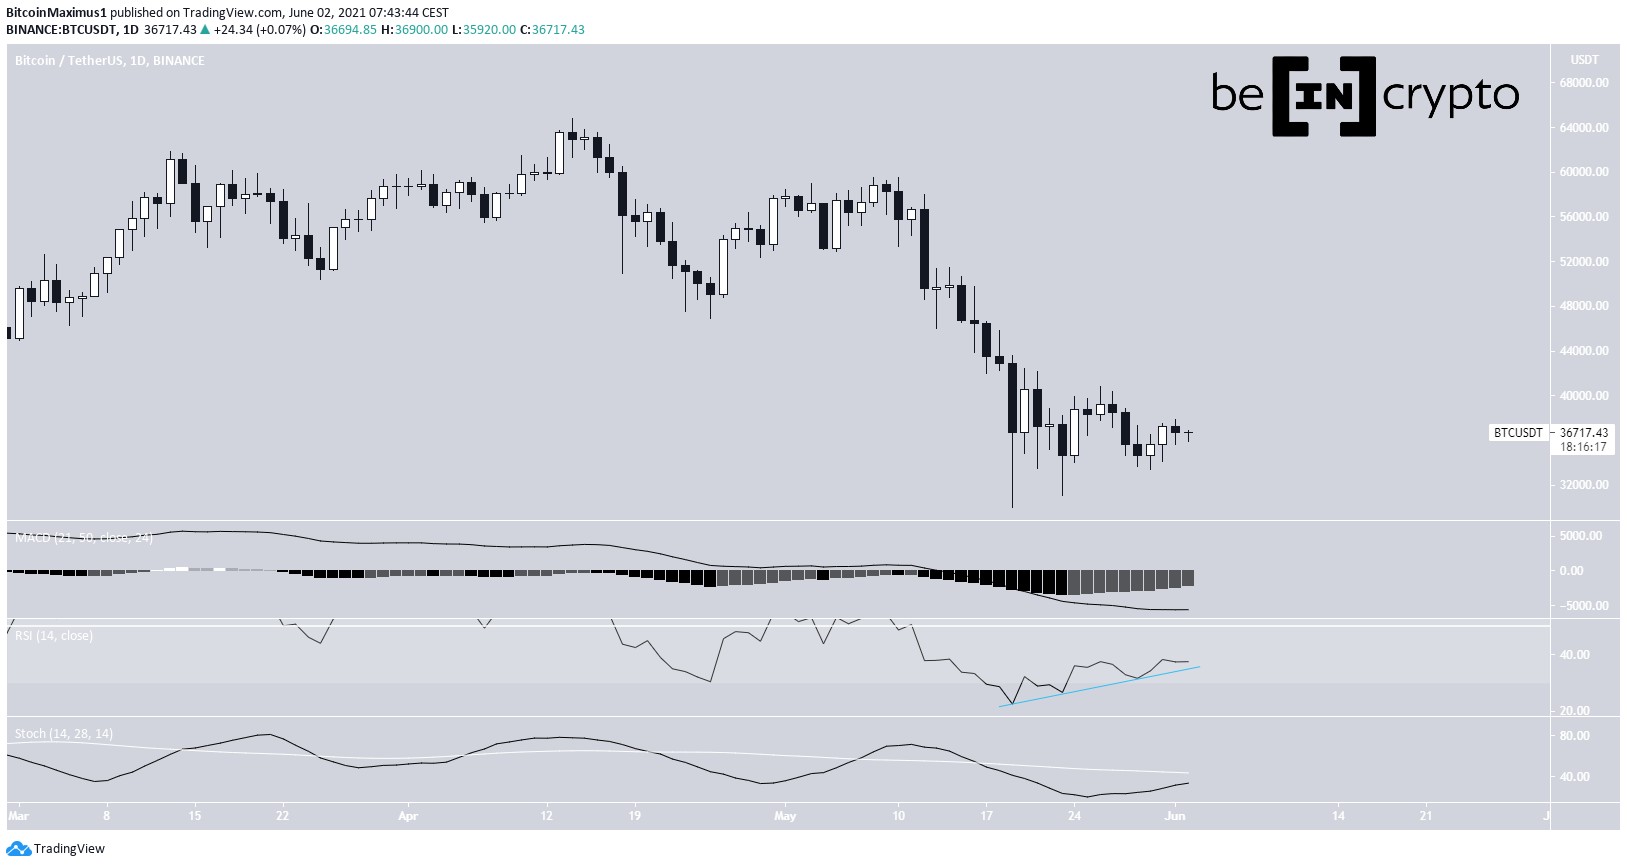
BTC resumes bounceThe daily time frame continues to provide a bullish outlook for BTC, mostly due to technical indicator readings.
The MACD is increasing and has given a bullish reversal signal and the RSI has completed a failure swing bottom. In addition, it’s generating a bullish divergence alongside an ascending support line (blue). Finally, the Stochastic oscillator is moving upwards and is relatively close to generating a bullish cross.
Therefore, the outlook from the daily time frame is bullish.
BTC Chart By TradingView
Short-term patternThe six-hour chart shows a symmetrical triangle in place since the May 19 low. This is normally considered a neutral pattern.
Furthermore, technical indicators are neutral. The MACD is close to the 0-line and the RSI is at 50.
The closest resistances are found at $41,200 and $48,200. These are the 0.382 and 0.618 Fib retracement resistance levels.
A breakout from the triangle would also indicate a breakout from the $41,200 resistance area, making a movement towards $48,200 expected.
BTC Chart By TradingView
Future BTC movementThe wave count is not entirely clear. Both the bullish and bearish scenario possibilities are still intact.
The bearish scenario indicates that BTC is currently in wave four of a five-wave bearish impulse.
This is supported by the rejection from the descending parallel channel (red icon).
A breakdown from the triangle would likely confirm this, giving potential targets near $24,800 and $20,000.
An increase above the wave 1 low (red line in the next image) would likely invalidate this possibility.
BTC Chart By TradingView
The bullish scenario suggests that the A-B-C correction is complete and the price will head upwards. This would be confirmed by a movement above the A wave low at $47,000 (red line) since that would invalidate the bearish impulse possibility.
Therefore, an increase to the $48,000 resistance area as outlined previously would confirm that the correction and the bottom are in.
Due to the readings from the daily time frame, this seems to be more likely.
For a more detailed look at wave counts, click here.
BTC Chart By TradingView
For BeInCrypto’s previous bitcoin (BTC) analysis, click here.
The post Bitcoin (BTC) Continues Consolidating After Bounce From Support appeared first on BeInCrypto.
origin »Bitcoin price in Telegram @btc_price_every_hour
Bitcoin (BTC) на Currencies.ru
|
|


