2021-11-15 10:55 |
Bitcoin (BTC) achieved a new all-time high price during the week of Nov 8-14, but failed to sustain its increase and fell during the latter portion of the week.
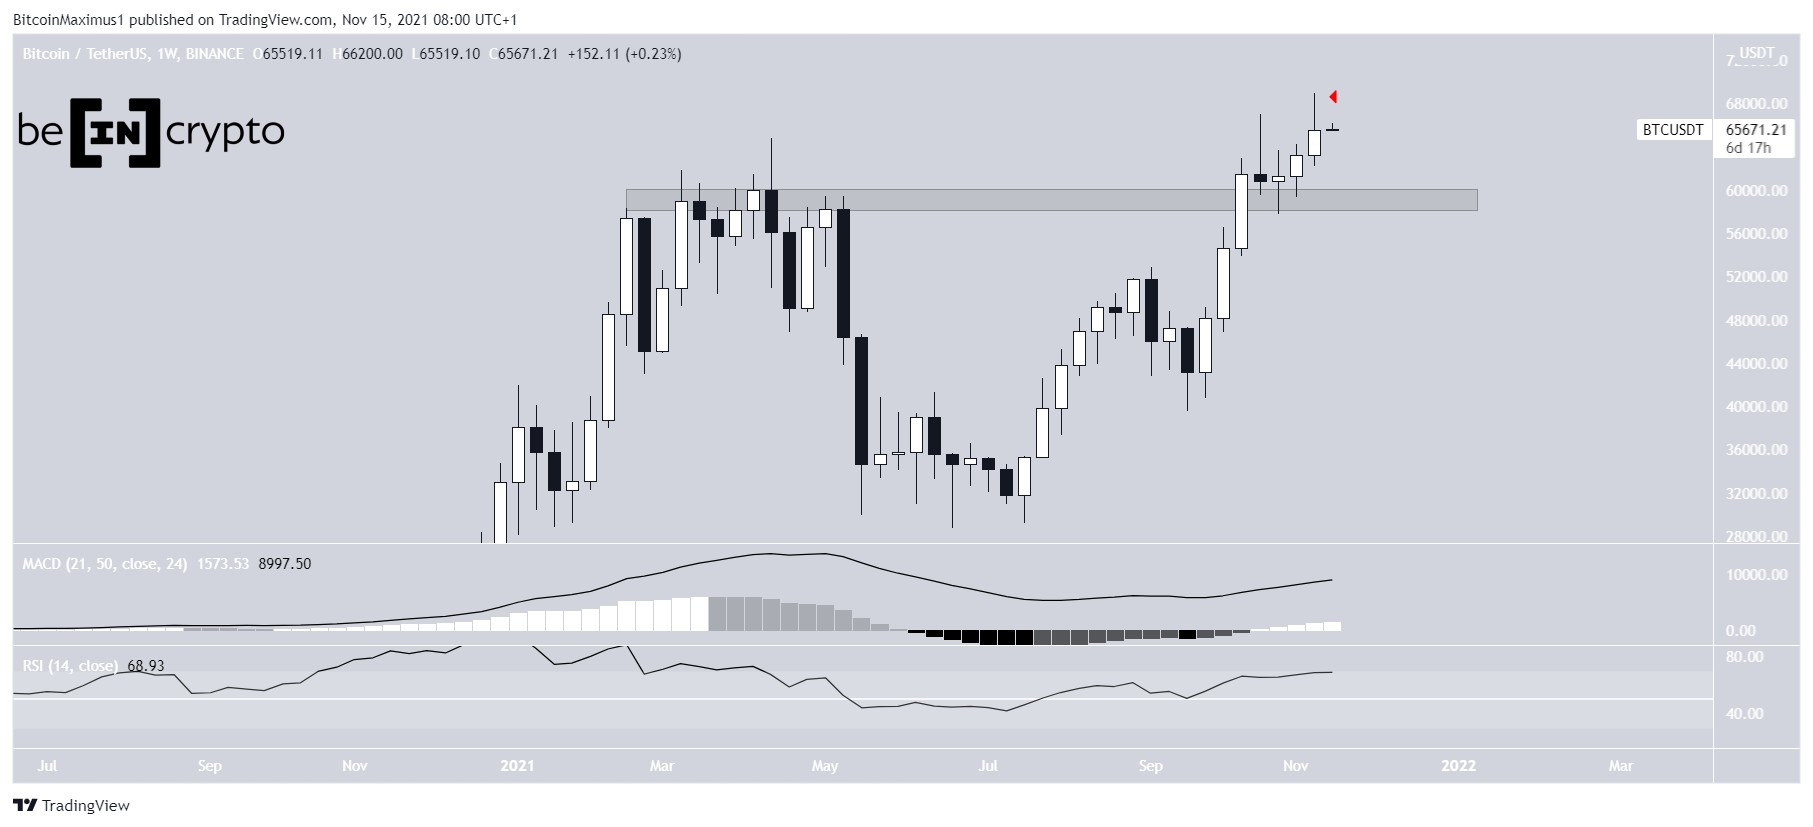
The weekly chart shows that despite the initial upward move, BTC created a weekly candlestick with a long upper wick (red icon). This is often considered a bearish sign of heightened selling pressure.
However, BTC is still trading above the $59,500 area, which is the previous all-time high region from May. The area acted as resistance on the way up and is now expected to act as support.
Technical indicators in the weekly time frame are bullish. The MACD, which is created by short and long-term moving averages (MA) is positive and increasing. This means that the short-term MA is moving faster than the long-term one and is considered a bullish signal.
The RSI, which is a momentum indicator, is above 50 and increasing. This is also considered a bullish sign and typically occurs during sharp upward movements.
Therefore, while the price action is ambiguous, technical indicator readings from the weekly time frame are bullish.
BTC Chart By TradingView Ongoing descentThe daily chart shows that BTC has been moving downwards since Nov 10, when it reached a new all-time high price of $69,000.
The downward move was preceded by bearish divergences (blue) in both the RSI and the MACD. This bearish development occurs when the price increase is not accompanied by an increase in momentum and can often happen before bearish trend reversals. The divergence was very pronounced, increasing its significance.
When using Fib levels, the closest support is found at $57,854. This is the 0.382 short-term Fib retracement (white).
There is stronger support between $53,700-$54,350, created by the short-term 0.5 Fib retracement support level and the long-term 0.382 level (black). Therefore, if BTC were to fall back to this region, it would be a likely spot for BTC to rebound.
BTC Chart By TradingViewThe six-hour chart shows that BTC is barely holding on above the $63,500 horizontal support area, which also coincides with an ascending support line.
Due to the confluence of support levels, a breakdown from the line/area would be a major bearish sign that could lead to much lower prices.
BTC Chart By TradingViewThe shorter-term 30-minute chart shows resistance at $66,660. This is the 0.618 Fib retracement resistance level.
Unless BTC clears this level, the correction cannot be considered complete.
BTC Chart By TradingView BTC wave countThere are two potential wave counts in play, both of which suggest another short-term downward move.
The first suggests that BTC has completed wave one (orange) of a five-wave upward move and is currently correcting inside wave two. The sub-wave count is shown in orange.
The first potential target for the bottom of wave two is found at $57,750 with a secondary target at $54,300.
BTC Chart By TradingViewThe second count suggests that BTC is currently in wave 2 (orange), and has been in this wave since the Oct 20 highs. In this case, the move is part of an irregular flat correction. This is a type of correction in which wave C (black) fails to move below the bottom of wave A (black). Therefore, it’s usually contained inside an ascending parallel channel.
In this possibility, BTC may only decrease towards $60,000 prior to spiking.
BTC Chart By TradingViewFor BeInCrypto’s previous Bitcoin (BTC) analysis, click here.
The post Bitcoin (BTC) Closes Relatively Bearish Week Despite New All-Time High appeared first on BeInCrypto.
origin »Bitcoin price in Telegram @btc_price_every_hour
Bitcoin (BTC) на Currencies.ru
|
|