2021-12-30 13:48 |
Bitcoin (BTC) has broken down from a trading pattern that had been in place since Dec 4. This indicates that BTC is still mired in a corrective pattern
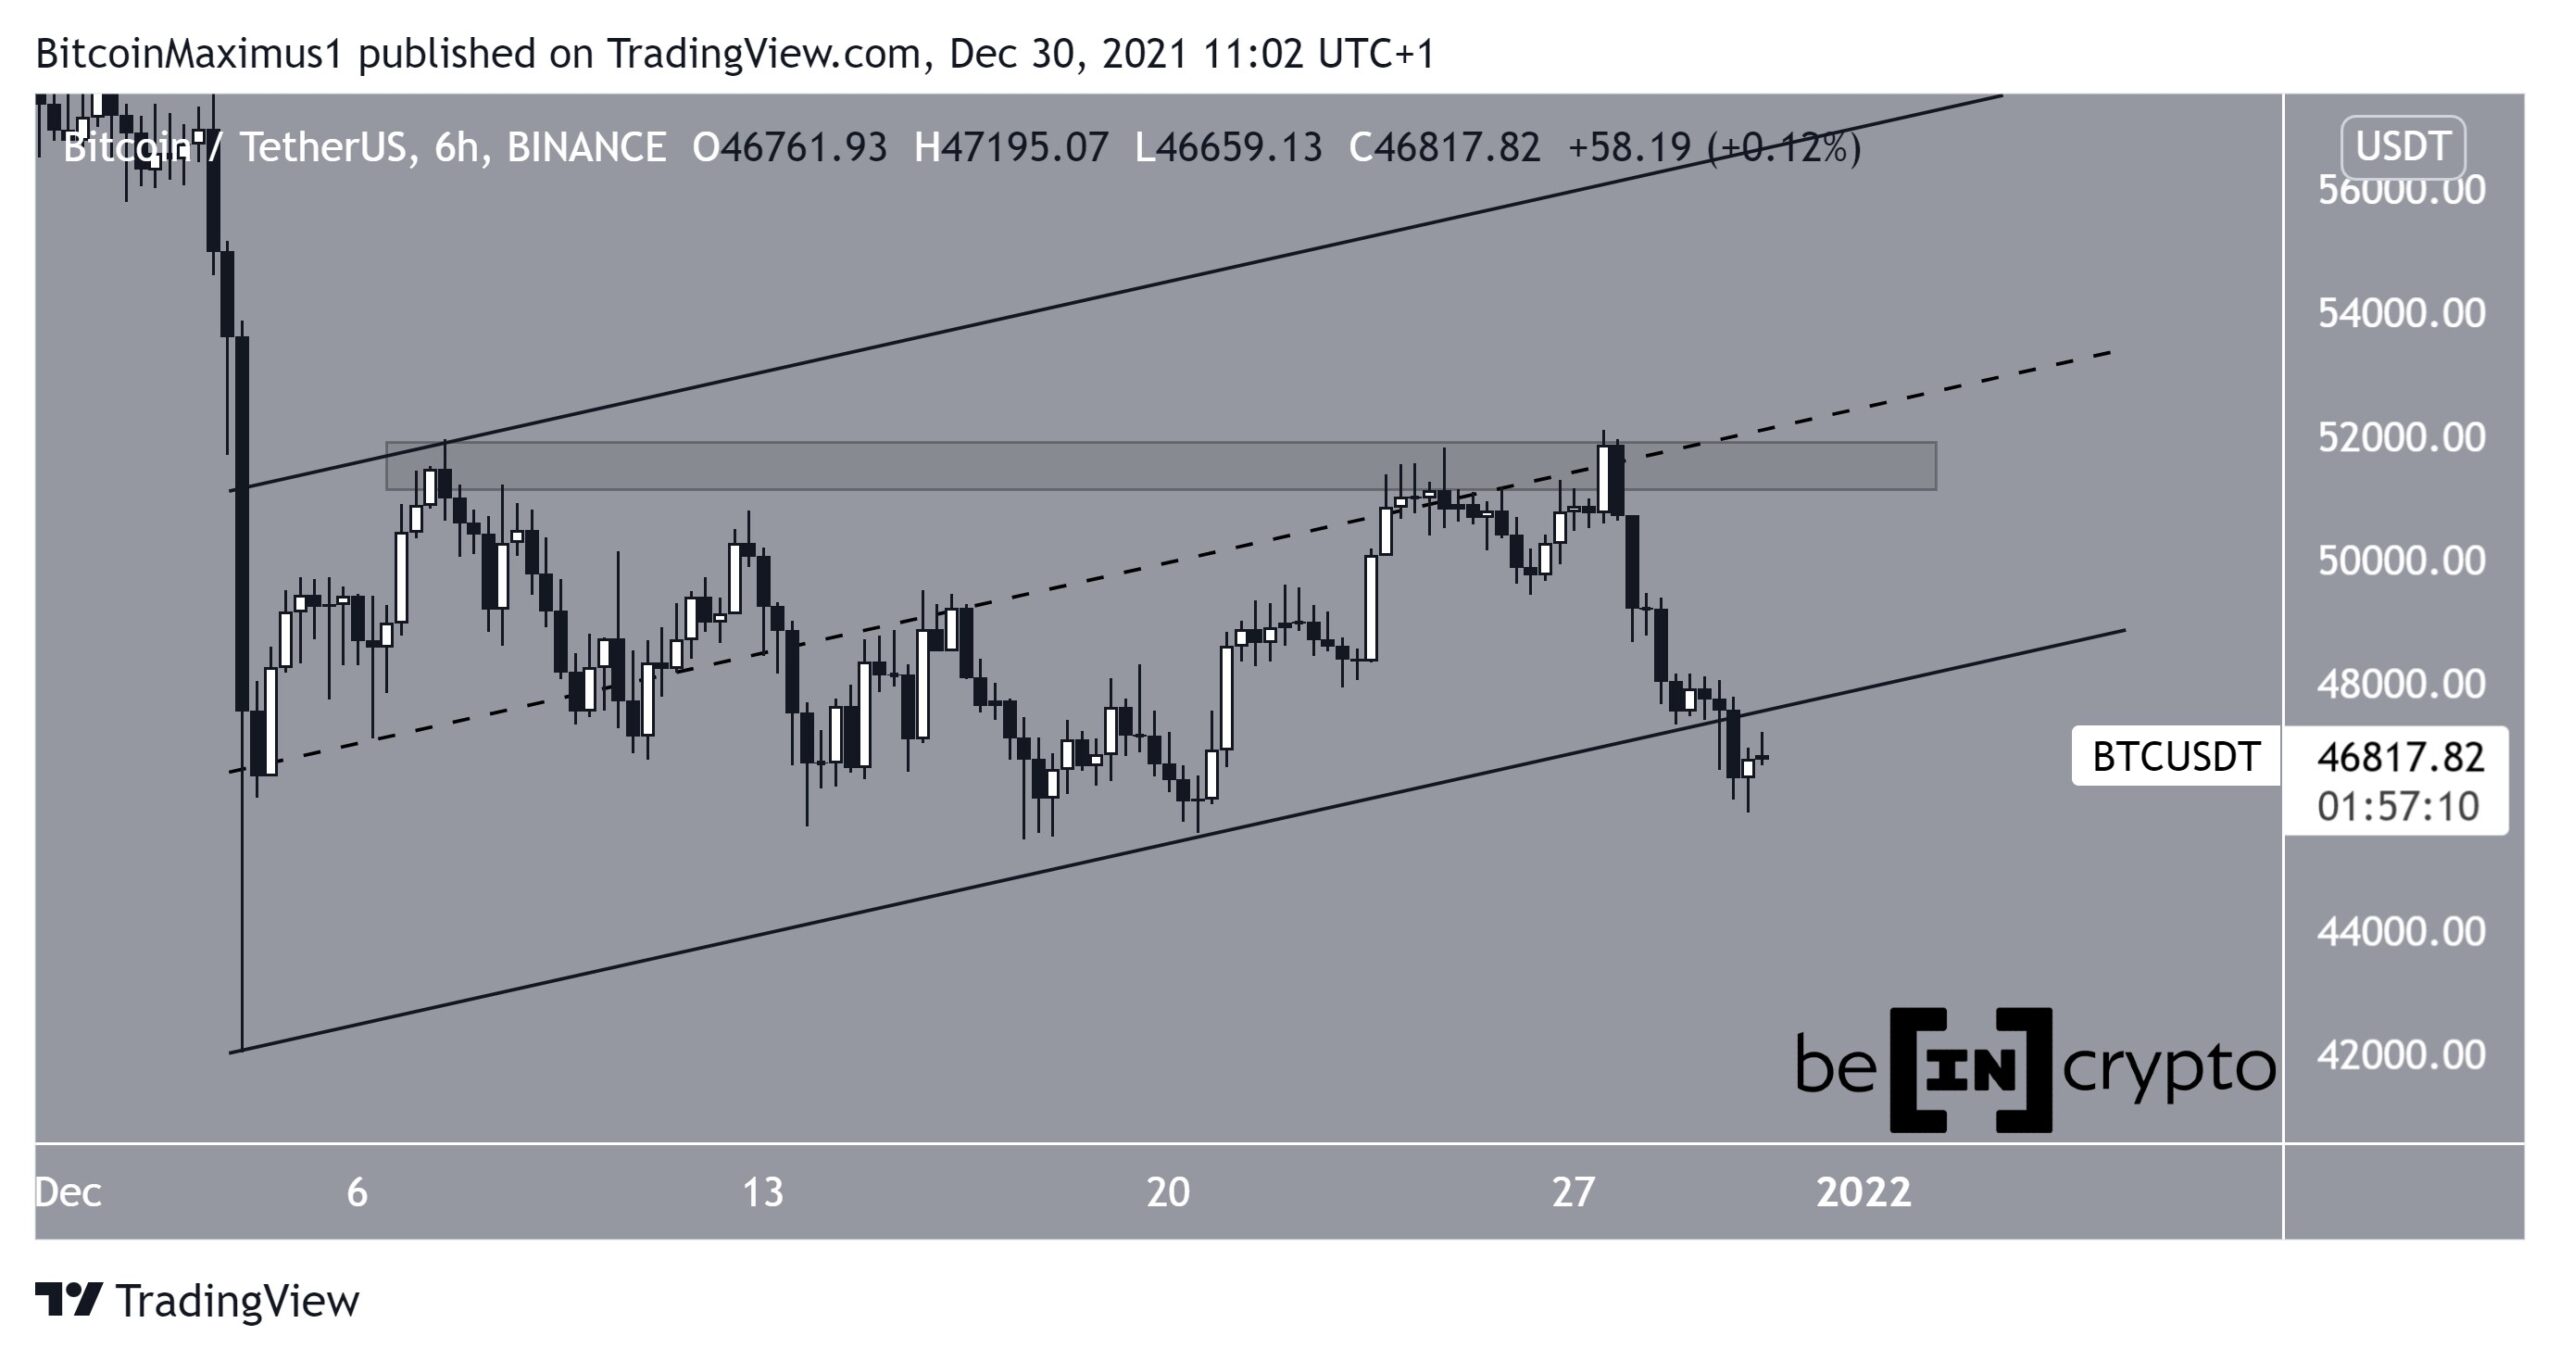
Bitcoin (BTC) had been trading inside an ascending parallel channel since reaching a local low on Dec 4. While trading inside or this channel, it reached a high of $52,088 on Dec 27.
The high served to validate the midline of the channel and the $51,600 horizontal resistance area as resistance. However, a downward move has been transpiring since.
On Dec 29, BTC broke down from the ascending parallel channel and proceeded to reach a low of $45,900. The breakdown from the channel is considered a bearish development and could lead to lower prices on the horizon.
BTC Chart By TradingView Short-term BTC movementThe six-hour chart shows that BTC is trading just above the 0.618 Fib retracement support level at $45,850. This level coincides with the Dec 13-20 lows.
This makes it likely for BTC to create a higher low inside the $44,145-$45,830 Fib support range before resuming its upward movement. This support range is created by the 0.618-0.786 Fib retracement support levels (white).
There are no bullish reversal signs in place at this time.
BTC Chart By TradingView Wave countDue to the breakdown from the channel, the wave count suggests that BTC is still mired in a corrective pattern and is likely in the X wave of a W-X-Y complex corrective structure (pink).
This wave should end between $44,100-$45,300, which is the 0.5-0.618 Fib retracement support levels (black).
Following this, an upward move toward the $55,500-$58,700 range (0.5-0.618 Fib retracement resistance levels) would be expected. This would complete the Y wave and the entire corrective structure.
BTC Chart By TradingViewFor BeInCrypto’s previous Bitcoin (BTC) analysis, click here
The post Bitcoin (BTC) Breaks Down From Ascending Channel, Testing December Lows appeared first on BeInCrypto.
origin »Bitcoin price in Telegram @btc_price_every_hour
Bitcoin (BTC) на Currencies.ru
|
|