2022-6-14 14:00 |
Bitcoin (BTC) bounced significantly after reaching a low of $20,855 and has possibly completed its corrective structure.
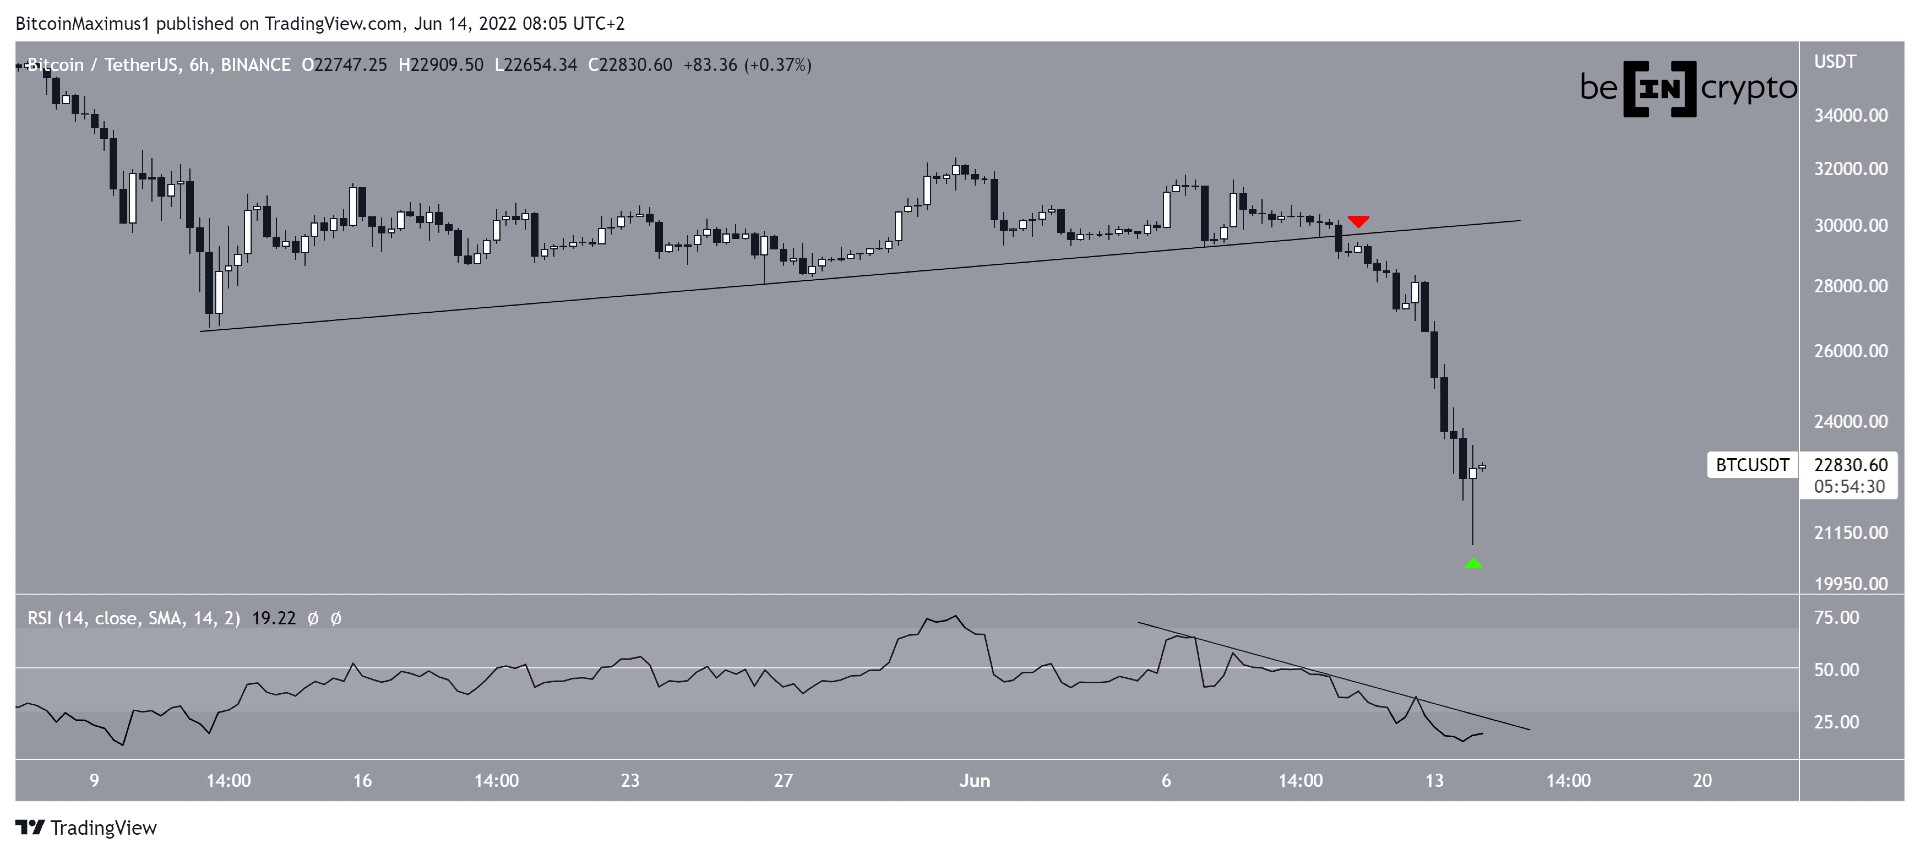
BTC has been falling since it broke down from an ascending support line on June 10 (red icon). The decrease has been swift and led to a low of $20,855 on June 14. This is the lowest price since Dec 2020.
The price bounced on June 14 and created a doji candlestick with a long lower wick (green icon). However, despite the bounce, the RSI is still following a descending resistance line. A breakout from this line would be required on order for the bounce to be considered a reversal.
BTC/USDT Chart By TradingView Short-term bounceThe upward movement since the aforementioned low looks impulsive, due to it being a five-wave increase. Additionally, the price has broken out from a short-term descending resistance line.
Currently, it is facing resistance at $22,650. An increase above this level and its subsequent validation as support would go a long way in suggesting that the bottom is in.
BTC/USDT Chart By TradingView BTC wave count analysisThe short-term wave count suggests that the price has completed a five-wave downward movement (black) measuring from the end of March.
The $20,825 low and subsequent bounce were made at a confluence of Fib targets between $21,850 and $22,650. The targets are given by the 1.61 external Fib retracement of wave four (black) and the length of wave one (white).
So, it is possible that a bottom has been made.
BTC/USD Chart By TradingViewAs for the long-term count, it is possible that BTC has just completed wave four (white) of a long-term five-wave upward movement that began in Dec 2018.
A decrease below the wave one high at $13,880 (red line) would invalidate this particular wave count.
BTC/USD Chart By TradingViewFor Be[in]Crypto’s previous bitcoin (BTC) analysis, click here
The post Bitcoin (BTC) Bounces by 12% Following Drop to $20,855 appeared first on BeInCrypto.
origin »Bitcoin price in Telegram @btc_price_every_hour
Bitcoin (BTC) на Currencies.ru
|
|


