2022-7-26 11:45 |
Bitcoin (BTC) has broken down from a short-term corrective pattern but is trading inside crucial horizontal and Fib support levels.
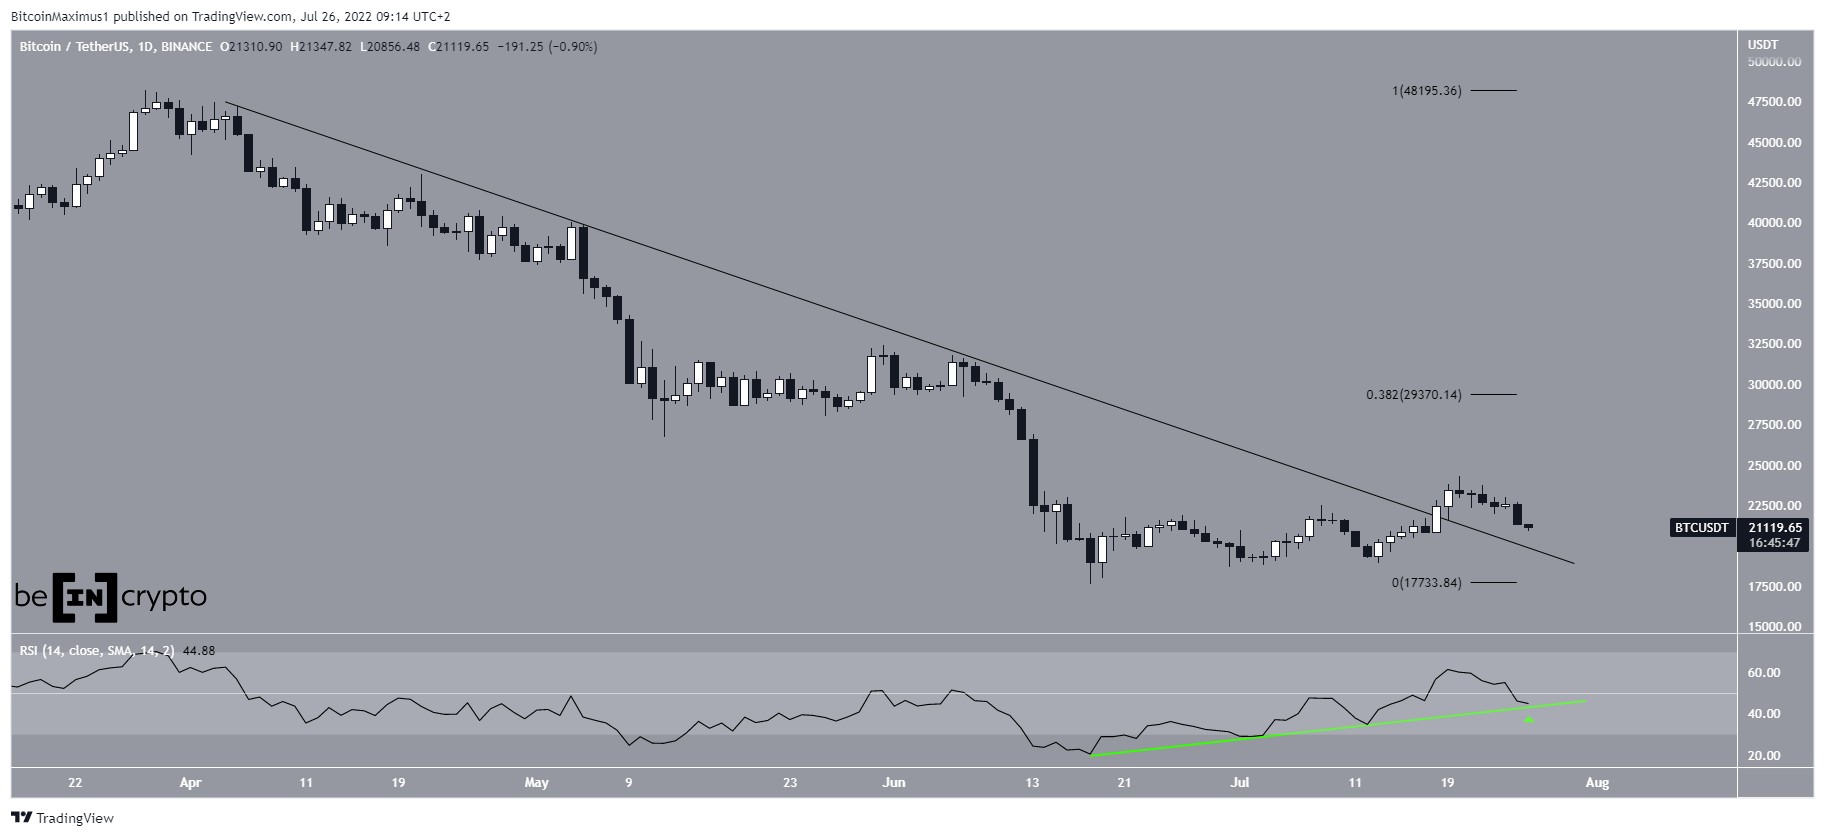
Bitcoin had been trading underneath a descending resistance line since April 5. The line caused several rejections, most recently on June 7. This led to a long-term low of $17,622 on June 18.
Bitcoin has been moving upwards since and managed to break out on July 18. Despite the breakout, it has returned to the resistance line once more in order to potentially validate it as support.
Additionally, the daily RSI has nearly returned to its bullish divergence trendline (green line). In order for the breakout to remain intact, the RSI has to bounce (green icon) at this line and resume its upward trajectory above 50.
If it does, the next closest resistance area would likely be found near $29,370. This target is the 0.382 Fib retracement resistance level.
BTC/USDT Chart By TradingView Short-term breakdownThe two-hour chart shows that BTC has broken down from a descending parallel channel that had been in place since July 20. This is slightly unusual, since such channels usually contain corrective movements.
Despite the breakdown, the price is currently trading inside the $21,000 support, which is both a horizontal support area and the 0.618 Fib retracement support level.
Moreover, the two-hour RSI is oversold. The previous time it was at this level was on July 12 (green icon), and preceded a significant upward move.
BTC/USDT Chart By TradingView BTC wave count analysisThe most likely short-term wave count suggests that Bitcoin is in wave two (yellow) of a five-wave upward trend.
The sub-wave count (black) shows a complex W-X-Y corrective pattern, in which waves W and Y had an exact 1:1 ratio.
BTC/USD Chart By TradingViewAs for the longer-term count, it seems that BTC has completed a five-wave downward move throughout the entirety of the previously outlined descending resistance line. In it, wave five was truncated.
If correct, it means that Bitcoin has reached a local bottom and will likely continue increasing.
BTC/USD Chart By TradingViewFor Be[in]Crypto’s previous bitcoin (BTC) analysis, click here
The post Bitcoin (BTC) Attempts to Create Higher-Low At $21,000 appeared first on BeInCrypto.
origin »Bitcoin price in Telegram @btc_price_every_hour
Bitcoin (BTC) на Currencies.ru
|
|


