2020-8-18 18:25 |
Binance Coin (BNB) has broken out from an important resistance level and validated it as support afterward.
Some technical indicators, however, suggest that a bearish reversal could transpire soon.
BNB Makes a Double-TopThe BNB price has been gradually increasing since March 13. The rally stalled near the end of July when the price reached the $21.50 area and was rejected.
On Aug 3, BNB was finally successful in breaking out above the $21.50 area and validated it as support afterward. If the price continues increasing, the next resistance area would be found at $25.50.
However, BNB has created what resembles a double-top, which is normally considered a bearish reversal pattern. The pattern is combined with a considerable bearish divergence in both the RSI and the MACD, even though the latter has begun to move upwards.
Therefore, it is possible that the price will revisit the $21.50 area to test support once more.
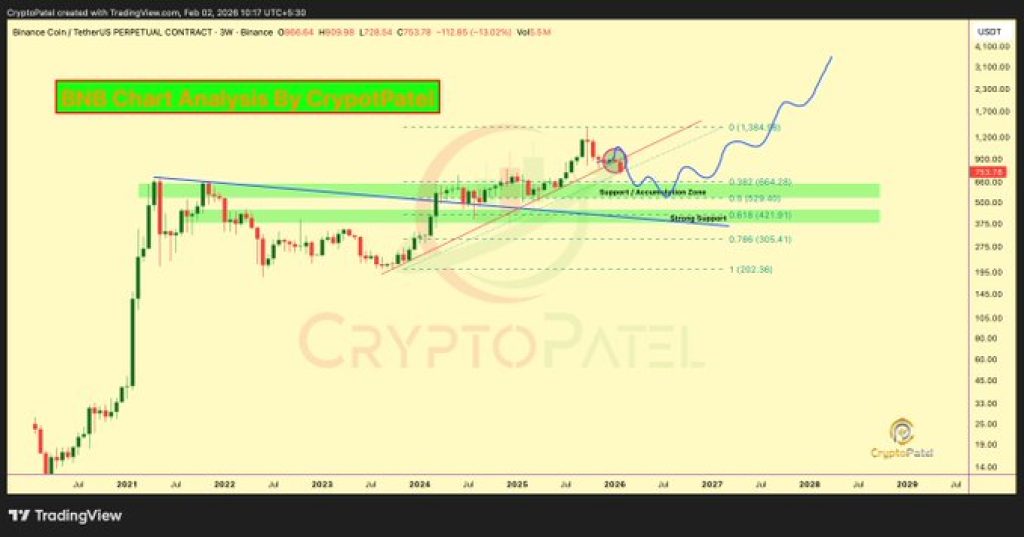
BNB Chart By TradingViewWhen looking at the weekly chart, we can see that there is a considerable hidden bearish divergence in the RSI. If a decrease occurs as a result, BNB could fall all the way to $17.70.
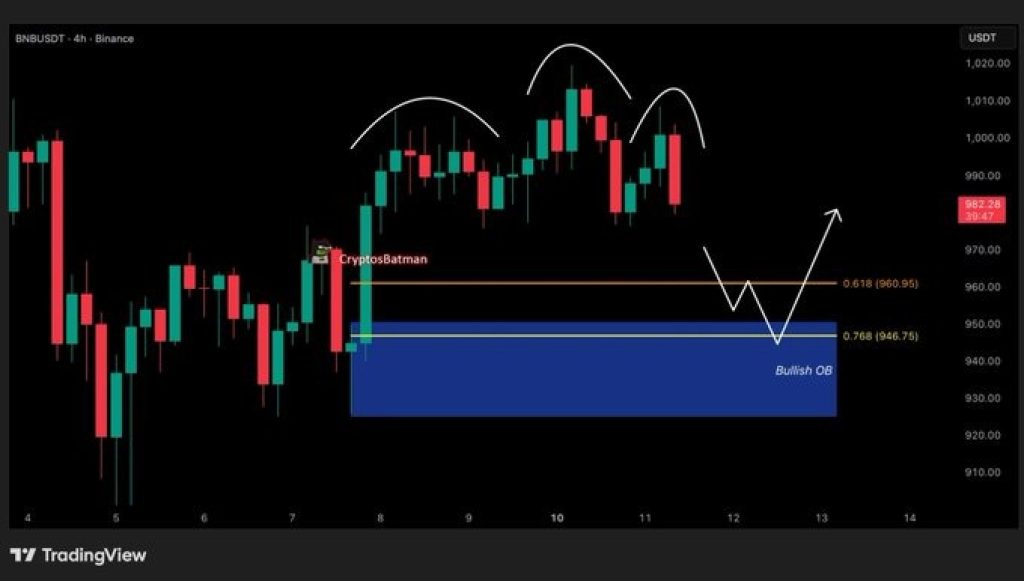
BNB Chart By TradingView Short-Term WeaknessThe short-term chart reveals some additional weaknesses.
First, we can see a deviation above the $23.50 area which could not be sustained, since BNB has fallen back below the resistance area.
Second, there is a pronounced bearish divergence in both the RSI and the MACD.
This indicates that the price is likely to move downward towards $22.
BNB Chart By TradingView Wave CountAs for the wave count, it is possible that the price began a five-wave formation on June 29, which ended with a high of $23.83 on Aug 5.
If the count is correct, the price is now near the top of a B wave, after which a decrease is expected to transpire. The multiple divergences support this possibility.
The low of the C wave could be reached near $19.30, the 0.5 Fib level of the entire upward move, and the previously mentioned support area.
Since the 1.382 Fib time level of the upward move lands on Aug 20, the C wave low should be reached after this date.
BNB Chart By TradingViewThe post Binance Coin (BNB) Struggles to Sustain Higher Prices After Breakout appeared first on BeInCrypto.
origin »Bitcoin price in Telegram @btc_price_every_hour
Binance Coin (BNB) на Currencies.ru
|
|