2022-6-2 03:47 |
Be[In]Crypto analyzes the price movement for seven different cryptocurrencies, including Bella Protocol (BEL), which is attempting to find support after a massive increase that began on May 30.
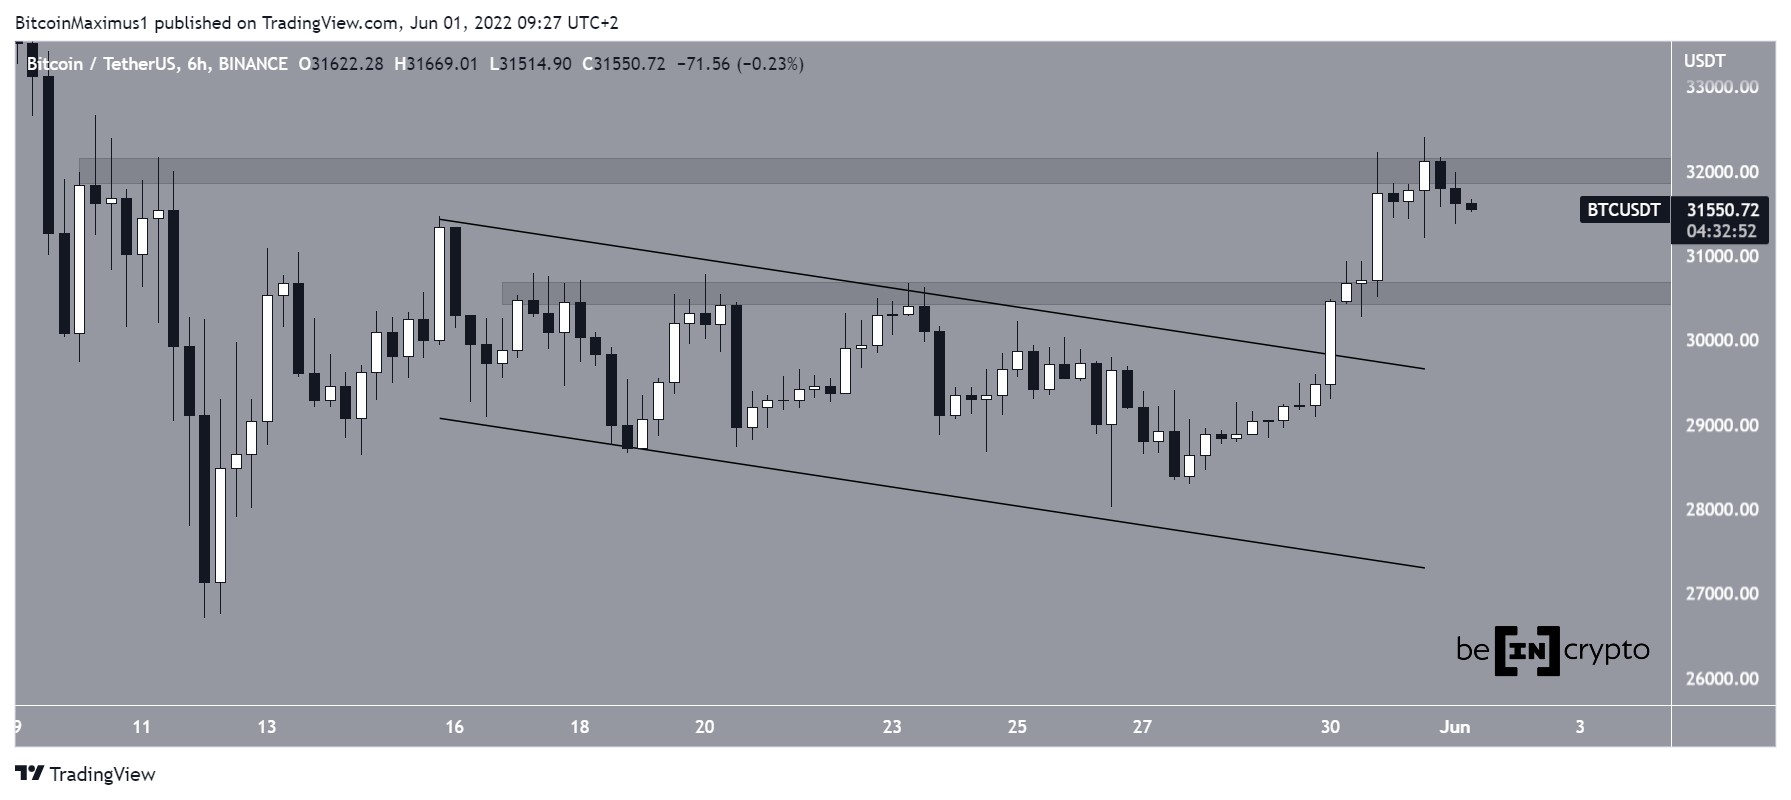
BTCOn May 30, BTC broke out from a descending parallel channel that had previously been in place since May 16 and proceeded to reach a local high of $32,399 on May 31.
Despite the increase, it failed to close above the $32,000 horizontal resistance area, which has been in place since May 10 and was rejected instead.
If the rejection continues, the closest support area would be found at $30,500.
BTC/USDT Chart By TradingView ETHSimilar to BTC, ETH broke out from a parallel channel on May 30. However, this was an ascending channel instead of a descending channel.
ETH validated the midline of the channel as support on May 30 (green icon) and proceeded to reach a local high of $2,016 on May 31.
The price has been decreasing since but has seemingly found support in the middle region of the channel (green circle).
If it is successful in validating this level as support, it could resume its upward movement.
ETH/USDT Chart By TradingView XRPXRP had been trading underneath a descending resistance line since May 13. The downward movement led to a low of $0.375 on May 26. The price has been moving upwards since and broke out from the line on May 30.
XRP validated the line as support (green icon) the next day. If it manages to hold on above the support line, it’s possible that the price will initiate an upward move toward the $0.455 resistance.
XRP/USDT Chart By TradingView BELBEL began to increase inside an ascending parallel channel on May 10. It broke out from this channel on May 29 but has yet to validate the channel as support. The breakout preceded a sharp upward move that led to a local high of $1.325 the next day.
While the price is already back inside the 0.5-0.618 Fib retracement support area of $0.70-$0.82, values close to $0.70 are likelier to provide stronger support, due to the fact that they coincide with the resistance line of the previous ascending parallel channel.
BEL/USDT Chart By TradingView SHIBSHIB had been falling inside a descending wedge since May 13. The descending wedge is considered a bullish pattern, meaning that a breakout from it is expected.
SHIB broke out on May 29 and proceeded to reach a local high of $0.0000125 on May 30. However, it was rejected and has been falling since.
SHIB/USDT Chart By TradingView APEAfter reaching a low of $5.17 on May 11, APE bounced sharply and proceeded to reach a high of $9.80 two days later.
It was then rejected by a descending resistance line and has been falling since and was rejected by the line on May 31 (red icon).
Until APE breaks out above this line, the trend cannot be considered bullish.
APE/USDT Chart By TradingView CAKECAKE has been increasing since May 12. On May 22, it seemingly broke out from the $4.75 horizontal resistance area but this turned out to be only a deviation (red circle). The price has fallen back below the area since.
The trend cannot be considered bullish until CAKE reclaims this level.
CAKE/USDT Chart By TradingViewFor Be[in]Crypto’s latest bitcoin (BTC) analysis, click here
The post Bella Protocol (BEL) Retraces After 320% Increase In Two Days — Multi Coin Analysis appeared first on BeInCrypto.
origin »Bitcoin price in Telegram @btc_price_every_hour
Bellscoin (BEL) íà Currencies.ru
|
|
