2022-11-14 16:31 |
Post-Merge Ethereum price action has kept traders wondering what’s in store for ETH going forward, but a few positive developments present good long-term prospects.
Bears have been at the forefront of the market, with the price action of top cryptocurrencies like Bitcoin and Ethereum dramatically down. With volatility leading the way, ETH price, much like BTC, has witnessed significant ups and downs for most of the last week.
Despite BTC price falling to two-year lows, Ether has managed to keep above the crucial $1,000 mark. Here, we decode ETH price action and what kept it alive.
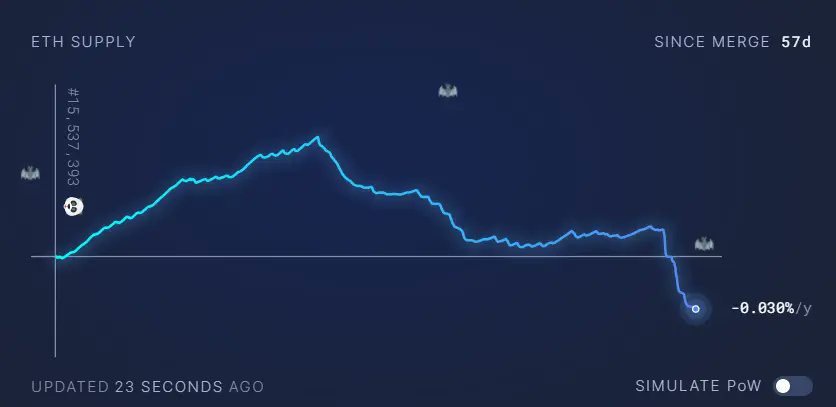
Ethereum Stays DeflationaryThe deflationary nature of Ethereum has often been questioned in the market. Official reports suggested that ETH achieved a nearly zero annualized issuance rate while increasing burning.
Before transitioning to proof-of-stake, miners were issued approximately 13,000 ETH/day. While stakers were issued roughly 1,700 ETH/day, based on about 14 million total, ETH staked. Since the Merge, only approximately 1,700 ETH/day remained, dropping total new ETH issuance by around 88%.
With the ETH issuance rate dropping drastically alongside the Ethereum burn, the same made ETH deflationary. A recent Messari post also highlighted that ETH reached a declining supply over the last week.
ETH supply | Source: MessariThus, with ETH supply reducing while the long-term prospects for the coin look secure, here’s how Ethereum can perform going forward.
ETH Price Still at CrossroadsWith the collapse of FTX, there are newer unseen situations that investors are experiencing. Bitcoin, for example, saw a new multi-year low of around $15,580. On the other hand, ETH price managed to hold its ground, but for how long?
Ethereum price fell to a low of $1,073 on Nov. 9, but the $1,000-$1,200 has acted as a solid support zone for the coin. At press time, ETH traded at $1,254, noting 1% daily gains. However, the weekly ETH price was down 20.58%.
ETH/USDT one-day chart | TradingViewNonetheless, buyers have managed to keep RSI above the oversold zone on the daily chart. An interesting trend was that the ETH Number of Addresses Holding 100+ Coins reached a 20-month high of 46,579.
ETH Number of Addresses Holding 100+ Coins | Source: GlassnodeEthereum Transaction Volume (7d MA) also made a four-month high of 174,425.427 ETH. With transaction volume on the rise, the same was indicative of a more vibrant network despite the bearish blues.
Ethereum Transaction Volume (7d MA) | Source: GlassnodeHowever, Ethereum active deposits noted a major uptick, while ETH daily active addresses saw a pullback. This was a bearish trend which indicated that the token was seeing less growth utility while funds were moving to exchanges for potential sell-offs.
Active Deposits and Daily Active Addresses | Source: SantimentEven though a bearish trend line appeared on ETH deposits vs. Active addresses, whale accumulation persisted.
IntoTheBlock’s In/Out of Money Indicator presented that a price fall below $1,231, where over 923,000 addresses hold 3.3 million ETH, could lead to further sell-offs. Below the $1,231 mark, there is little support for Ethereum prices.
In/Out of Money Around Price | IntoTheBlockIn case of a bullish push, the $1,300 mark could act as a resistance, where 2.3 million addresses hold 3.55 million ETH.
Disclaimer: BeinCrypto strives to provide accurate and up-to-date information, but it will not be responsible for any missing facts or inaccurate data. You comply and understand that you should use any of this information at your own risk. Cryptocurrencies are highly volatile financial assets, so research and make financial decisions.
The post As Ethereum Becomes More Deflationary Than Ever, Here’s What to Expect From ETH Price appeared first on BeInCrypto.
origin »Bitcoin price in Telegram @btc_price_every_hour
Ethereum (ETH) на Currencies.ru
|
|


