2019-7-3 22:18 |
Following Bitcoin’s rebound from $9,600 support, the market seems to be bouncing and giving signals that the retrace is over. This technical analysis will determine whether Ethereum, XRP and Litecoin will continue falling or if a bull trend is about to resume.
The whole cryptocurrency market seems to be going through a corrective period following the exponential move that nearly took Bitcoin to $14,000. Due to the speed of the recent upswing, a significant pullback was needed to keep the bullish trend healthy. The bounce is taking a handful of top altcoins with the trend.
EthereumA spinning top candlestick pattern formed last week on Ethereum’s 1-week chart. This technical formation represents indecision about the future direction of this cryptocurrency since neither the bulls nor the bears were able to gain control of the price action. However, since the current candlestick is a green nine, which is a sell signal per the TD sequential indicator, when combined with the spinning top candlestick pattern the probabilities for a significant correction increase.
If Ethereum breaks below the 150-week moving average, which acted as a strong point of resistance for 5 weeks and now it appears to be acting as strong support, its market valuation could experience a sharp decline down to the 50-week moving average that is currently sitting around $190.
ETH/USD chart by TradingViewOn its way down, Ethereum will have to break through the Fibonacci retracement levels that could behave as barriers due to the high concentration of demand around them. This technical index predicts that if ETH was to correct down to the 61.8 percent Fibonacci retracement zone, which represents a 32 percent decline from the current price level, it could find support around the $256 and $223 levels, based on the 3-day chart.
ETH/USD chart by TradingViewAlong the same lines, the ascending parallel channel on the 1-day chart could be indicating that if the bearish signals seen on the bigger timeframes are validated, Ethereum could go down to the bottom of the channel. This technical pattern began developing in mid-December 2018 when ETH was trading at $83 and has since then it been able to contain its price action.
Every time Ethereum reaches the top of the channel it retraces to the middle of the channel or the bottom and then bounces off to the top once again. Thus, a similar scenario could be underway.
Since this cryptocurrency is currently trading around the middle line of the channel it could go down to the bottom, which is also where the 50 percent Fibonacci retracement level sits, and bounce off to new highs marking the end of the correction.
ETH/USD chart by TradingView XRPAfter failing to break above the $0.46 resistance level, XRP pulled back to the $0.38 support where it seems to be forming a reversal candlestick on the 1-week chart. Although it is too early to tell if the current candlestick will indeed take XRP up, the price action that this cryptocurrency has had during the past 6 weeks could signal that an upswing back to the $0.46 resistance level is likely to come.
Nonetheless, if the selling pressure continues to increase and XRP moves below the $0.38 support level it could try to test $0.30.
XRP/USD chart by TradingViewOn the 3-day chart, there is no sign of an upswing back to resistance nor a break of support. Based on this timeframe it will be wiser to wait for a move above the 7-three-day moving average in order to take a bullish stance or a move below the 30 and 50-three-day moving average to take a bearish stance.
XRP/USD chart by TradingViewYet, the ascending parallel channel that can be seen on the 1-day chart could actually add credibility to the idea that XRP will bounce off from the $0.38 support level to test the $0.46 resistance level again. This formation developed over a month ago and could be forecasting that if volume starts picking up and XRP is able to rise again, it could reach the middle or the top of the channel, but if the buy pressure is enough to make it break out of the channel a 35 percent upswing upon the break could be expected.
XRP/USD chart by TradingView LitecoinThe Litecoin halving—a fixed event that occurs every four years after 840,000 blocks are mined, which reduces the mining reward by 50 percent—is just 34 days away and different technical patterns are indicating that this cryptocurrency could be preparing for a major pullback.
On the 1-week chart, for example, an evening doji star candlestick formation developed over the last 3 weeks. This is a bearish reversal pattern signaling that if Litecoin breaks below the $115 hurdle point it could go down to the next level of support at $93.5, $70, or even $57.
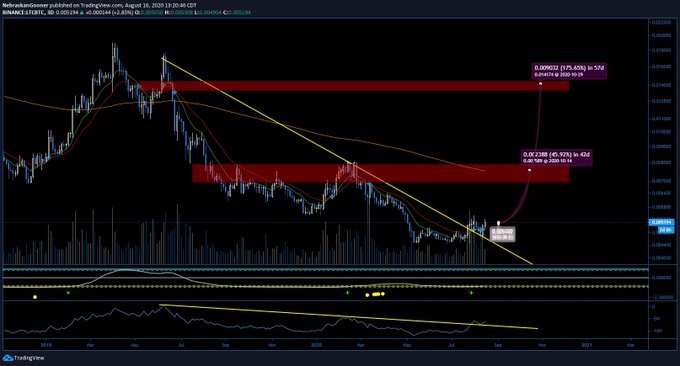
LTC/USD chart by TradingViewIf the bearish formation previously described is validated, then the ascending parallel channel that can be seen on the 3-day chart where Litecoin has been trading since mid-December 2018 could be about to break to the downside.
Due to the longevity of this parallel channel, a break out could accelerate the selling pressure resulting in a massive correction. But, if the channel continues to hold, a move up to the middle or the top could be expected with the potential to take this cryptocurrency to new yearly highs.
LTC/USD chart by TradingViewTherefore, if the evening doji star candlestick formation and a break below the ascending channel are confirmed, history will likely repeat itself and Litecoin could fall another 40 percent to try to test the support given by the 200-day moving average on the 1-day chart just as it did in 2015. This could take the cryptocurrency back to $70, representing a 53 percent correction from the recent high of $147.
LTC/USD charts by TradingView Overall SentimentUnder the longer-term timeframes, Ethereum and Litecoin appear to be turning bearish while XRP looks bullish. Conversely, the short-term outlook signals that the ascending parallel channels where all of these cryptocurrencies have been trading could allow them to bounce off from support sometime soon.
Usually, the broader perspective outweighs the narrower one, so even if ETH and LTC rise during the next few days it does not necessarily mean that they will make higher highs. As a matter of fact, the bullish signal will be given once, and if, these two cryptocurrencies are able to move above their recent yearly highs. In order to take a bullish stance it will be wiser to wait for Ethereum to move above $363, XRP above $0.42 and Litecoin above $147.
The post As Bitcoin bounces, are Ethereum, XRP, and Litecoin on their way to new yearly highs? appeared first on CryptoSlate.
origin »Bitcoin price in Telegram @btc_price_every_hour
Bitcoin (BTC) на Currencies.ru
|
|