2020-10-16 10:12 |
The price of the S&P 500 Index (SPX) has regained all of its losses from the beginning of March and reached a new yearly high. Since March, the movements of the Bitcoin (BTC) price and the SPX have mirrored each other.
New Yearly HighOn Feb. 20, the SPX price reached a high of $3,398. A sharp downward move followed, leading to a low of $2,178 on Mar. 23. In a span of slightly more than a month, the index had lost 36% of its value. However, the price has been increasing rapidly since.
On Sept. 2, SPX reached a high of $3,588, higher than that in February, before decreasing slightly in order to validate the $3,300 area as support. After creating a long lower wick, SPX began to move upwards.
Technical indicators in the daily time-frame are mixed. The RSI is increasing and trading above 50, but has generated considerable bearish divergence.
The Stochastic Oscillator has made a bullish cross, but generated significant bearish divergence afterward.
SPX Chart By TradingViewCryptocurrency trader @TradingSurfers outlined an SPX chart, in which they expected the price to increase until 2021.
Source: TwitterTechnical indicators in the daily time-frame support this potential increase. The MACD has just turned positive, along with a bullish cross in the Stochastic Oscillator. The previous time this occurred, a rapid upward move followed (blue arrow).
Furthermore, the RSI is above 50, suggesting that the trend is bullish.
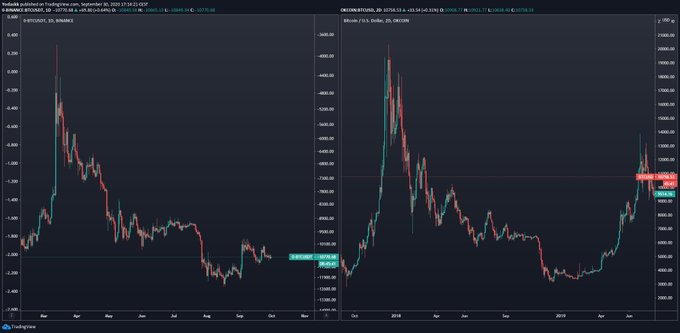
SPX Chart By TradingView Relationship To BitcoinThe relationship between the price of SPX (shown in candlesticks) and Bitcoin (orange) has been positive at least since the March drop, meaning that an increase in one has also caused an increase in the other. With the exception of two nearly one-month periods — in May and August — the movement of one has almost mirrored the other.
SPX Chart By TradingViewSince the beginning of October, the relationship is even more identical, with the price of both increasing at nearly the same rate.
Therefore, a decrease in the SPX price could cause the same in BTC and vice versa.
SPX Chart By TradingViewFor BeInCrypto’s latest Bitcoin analysis, click here!
Disclaimer: Cryptocurrency trading carries a high level of risk and may not be suitable for all investors. The views expressed in this article do not reflect those of BeInCrypto.
The post Are Bitcoin And S&P 500 Prices Correlated With Each Other? appeared first on BeInCrypto.
origin »Bitcoin price in Telegram @btc_price_every_hour
Bitcoin (BTC) на Currencies.ru
|
|