ARBITRUM PRICE ANALYSIS & PREDICTION (January 6) – ARB Regains Lost Ground But Yet To Recovery Fully, Up 20% Weekly

2025-1-6 11:13

As volume troops back in the market, ARB advanced bullish and posted gains to test the $0.9 level today. This level has halted buying activity in the past hour but it is expected to continue if the volume level increases.

Last December’s drop took many by surprise as several altcoins including ARB broke down to a month low during the market-wide correction.

Technically, that correction was healthy for the market to enable robust growth in the future, although it caused a serious panic in the market but the sellers short-lived their expectations as the price bounced back.

While the sellers aim to resume pressure during the brief consolidation phase, the bulls took advantage of the bounce this week and pushed higher amid current rising demand. Fortunately, the wide but short correction halted and the price increased consistently.

Looking at the latest setup, the bulls are back in action, although they are yet to recover all the lost grounds. A clear break above the previous monthly high should set the stage for a massive bullish move.

Conversely, a rejection there could subject the price to a consolidation before breaking up. Now that ARB is starting the new year in a grand style, we can expect an explosive move when a break-up occurs.
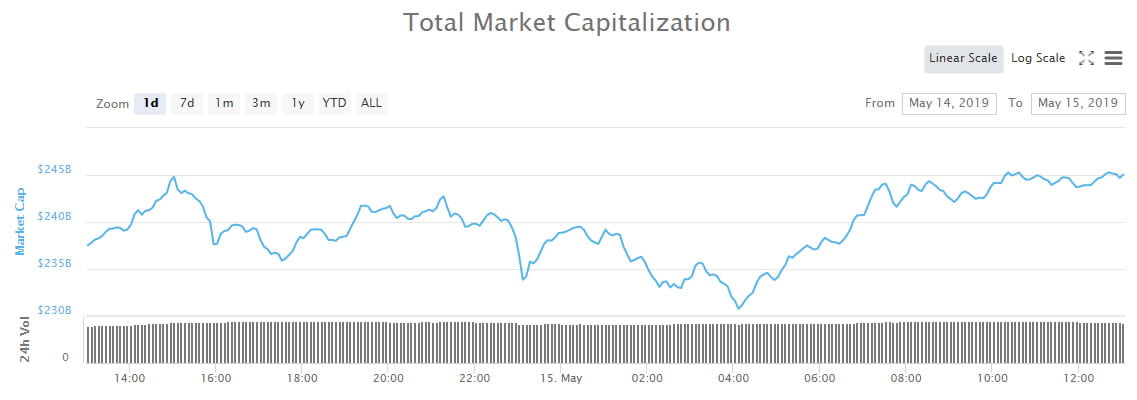
ARB’s Key Level To Watch

Source: Tradingview

Aside from the close $0.96 resistance, the key target level for the bulls right now is $1.1. If they overcome it, the $1.24 level would be the next resistance to watch with a potential breakout to $2 in the near term.

A drop from the current trading level could trigger a small pullback to $0.74. Meanwhile, the latest move is supported by $0.7. Lower levels to watch for a breakdown are $0.613 and $0.57.

Key Resistance Levels: $0.96, $1.1, $1.24

Key Support Levels: $0.705, $0.613, $0.57

Spot Price: $0.89 Trend: Bullish Volatility: High

Disclosure: This is not trading or investment advice. Always do your research before buying any cryptocurrency or investing in any services.

Follow us on Twitter @nulltxnews to stay updated with the latest Crypto, NFT, AI, Cybersecurity, Distributed Computing, and Metaverse news!

origin »

Level Up Coin (LUC) на Currencies.ru

$ 0 (+0.68%)
Объем 24H $0
Изменеия 24h: 1.94 %, 7d: 12.29 %
Cегодня L: $0 - H: $0
Капитализация $0 Rank 99999
Доступно / Всего 996.923m LUC

level volume arb posted today test halted

level volume → Результатов: 126


Fundamentals Bolstering Price? On-Chain Bitcoin Volume Hits 16-Month High

The Bitcoin daily transaction volume is now at its highest level since January 2018 showing increased on-chain economic activity. Meanwhile, transaction count and average blocksize on the network continue to move in the same upward direction, proof that the 1MB blocksize limit is well and truly a thing of the past in the post-SegWit Bitcoin era.

2019-5-4 19:00


Anxious Traders Beware: Bitcoin (BTC) May Range Sideways for Weeks to Come

Despite losing the majority of its upwards momentum over the past week, Bitcoin has been able to continue climbing higher and is now approaching the $5,300 level. BTC’s ability to continue climbing higher despite the lack of major buying volume has been technically positive, but traders are still laying out potential bear scenarios that could.

2019-4-19 03:00


Фото:

Bitcoin Price Analysis: Slow Upward Drift Tests Market Supply

A slow, grinding upward drift has been the name of the game for bitcoin’s market over the last few weeks. The upward drift is bringing us slowly to a level that was previously rejected violently:Figure 1: BTC-USD, Daily Candles, Upward DriftOur third rejection of the red resistance level shown above brought the market into a test of macro support in the mid-$3,000s.

2019-3-23 01:23


Фото:

Bitcoin Price Analysis: Slow Grind Could Lead to Short Squeeze

Last Friday, we discussed a macro resistance level bitcoin would likely test. The level was tested three times prior and immediately rejected. Now, for the fourth time, we find ourselves situated above the level as we wait to see if our support holds:Figure 1: BTC-USD, Daily Candles, Fourth Test of Macro ResistanceThe first three attempts to hold support above the black, broken resistance have been stifled with relatively high amounts of volume.

2019-3-19 01:17


Фото:

Bitcoin Price Analysis: Low Time Frames Show Signs of Life Amid Weekly Tests

Bitcoin continues to coil tightly within its range-bound market as the bulls and bears fight it out to see which is most dominant. On the lower time frames (TF), bitcoin is managing to find support:Figure 1: BTC-USD, 2-Hour Candles, Low TF SupportThe zone outlined by the green line in Figure 1 represents local support that has kept the market afloat for the last week and a half.

2019-3-13 22:26


Bitcoin (BTC) Transaction Volume Nears All-Time-Highs Despite Gloomy Market Conditions

Following an extended period of sideways trading, the cryptocurrency markets dropped today as Bitcoin failed to hold above its recently established support level at $3,800. BTC’s drop below this level has led many cryptocurrencies to plunge 5% or more, signaling that greater volatility is likely to come as the week continues on.

2019-3-5 01:00


Фото:

Top-20 Exchange Just For One Year! The Story Of LATOKEN

Less than two years have passed since the ICO stage and LATOKEN is already among biggest exchanges in the world by daily trading volume. How it was possible to reach this level for such a short period of time? What helped to develop such a sophisticated project? What are the major trends in crypto field […] The post Top-20 Exchange Just For One Year! The Story Of LATOKEN appeared first on ZyCrypto.

2019-3-2 20:22


Фото:

Bitcoin Price Analysis: Keep an Eye Out for a Close Above the Current High

Shortly after falling from its test of the low $4,000s, bitcoin managed to find support in the mid $3,500s. This has proven to be a relevant level over the last few months, and finding support here would be a sign of relatively strong demand:Figure 1: BTC-USD, Daily Candles, Local SupportThe high candle spread rejection following our test of the low $4,000s was an indication that we had strong levels of supply left in the market, but for the time being we are holding support.

2019-3-1 03:44


Фото:

Bitcoin Price Analysis: Bullish Rejection Wipes Out Bitcoin’s Weekend Gains

Over the weekend, a strong rally was stifled by an even stronger rejection as the bitcoin market was shoved into a band of overhanging resistance. This band of resistance has been mentioned several times in our analyses over the last few weeks as it has proven impossible to overcome for the time being:Figure 1: BTC-USD, Daily Candles, Failed BreakoutThis run to the low $4,000s coincided with a breakout of a rather large symmetrical triangle consolidation shown above.

2019-2-26 02:42


Фото:

Bitcoin Price Analysis: Bullish Setups Could Break Current Market Structure

The cryptomarket remains coiled as we lead into the weekend with no new highs and no new lows being established for bitcoin. However, it is nicely consolidating on lower time frames and hints toward the possibility of another leg up:Figure 1: BTC-USD, Hourly Candles, Consolidating PennantThe pattern shown in Figure 1 outlines a potential continuation pattern called a “bullish pennant.

2019-2-23 02:23


Фото:

Bitcoin Price Analysis: After Sudden Upswing, Bitcoin Price Drifts Downward

Last week, we saw a violent move to the upside as bitcoin rallied 11% over the course of one day. Since peaking in the upper $3,600s, bitcoin has seen close to zero bullish follow-through, and the price has begun to drift downward over the course of the last week:Figure 1: BTC-USD, Hourly Candles, Downward DriftDownward-drifting markets like this can often be a sign that distribution is taking place.

2019-2-15 00:21