2020-3-27 17:55 |
Both Bitcoin and gold have been speculated to be considered safe-haven assets at various points in their existence. This suggests that in times of economic uncertainty, demand for such assets would increase. The movement since the March 11-13 decrease has further solidified this possibility.
Cryptocurrency analyst @IncomeSharks tweeted a chart comparing the recent movement of gold and Bitcoin. Since the movement is very similar, he argues that it gives more credence to the argument that gold and Bitcoin are viewed as safe havens during times of turmoil.
$GOLD and $BTC charts. Very similar price movements this past year. Makes the safe haven argument more valid pic.twitter.com/4yu0lU8ctU
— Income Sharks (@IncomeSharks) March 26, 2020
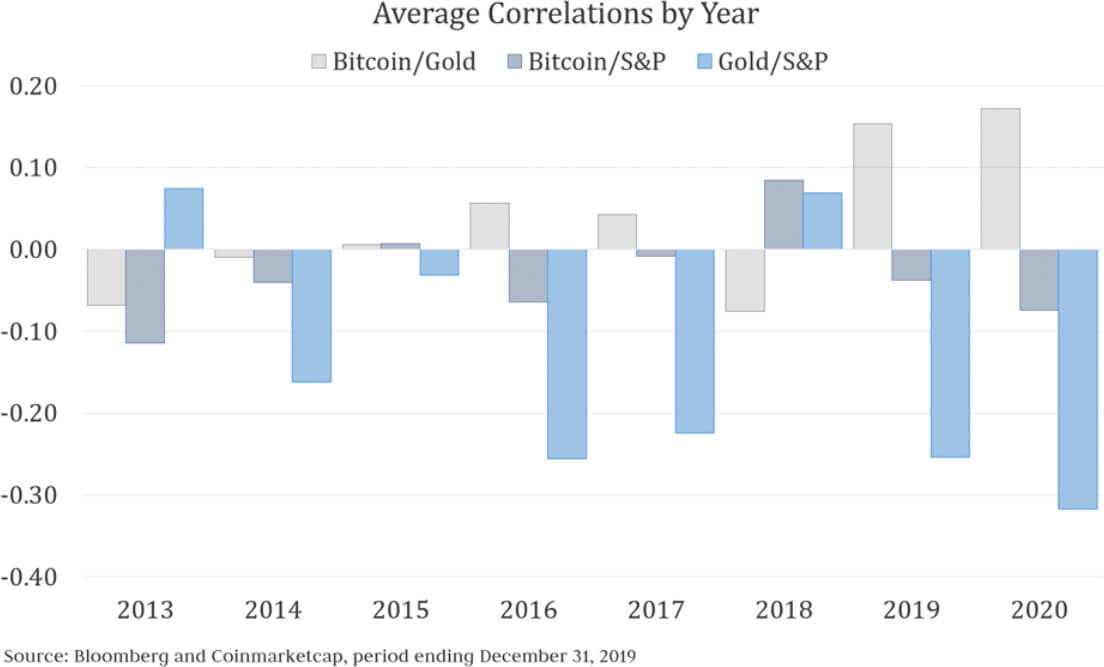
Our previous article compared the BTC, gold and silver prices in the long-term. This one will only tackle the gold and Bitcoin prices, focusing on the correlation in 2020.
Yearly ComparisonThe Bitcoin and gold prices have not been extremely correlated since the beginning of the year. We can divide the movement into three phases:
Phase 1 (Jan. 1 – Feb. 13)During this phase, the BTC price increased considerably, reaching a high of 45% relative to the beginning of the year. On the other hand, the gold price had only increased incrementally, moving in a range of +2 and +5 percent relative to Jan. 1 prices.
Phase 2 (Feb. 13 – March 12)During this phase, the BTC price began to decrease significantly, while the price of gold accelerated its rate of increase. This caused the yearly rate of increase for gold to surpass that of BTC on March 9, being at 10% and 9%, respectively.
Phase 3 (March 13 – Now)During this phase, both the BTC and gold prices have decreased significantly. However, the decrease has been much more pronounced in the BTC price, which at one point was 40% lower than the price on Jan. 1. To the contrary, the gold price only decreased a maximum of 3% below the yearly opening prices. At the time of writing, the BTC price was trading 7% below the price on Jan. 1, while the gold price was trading 7% above.
Bitcoin & Gold Chart By Trading View Movement Since The CrashHowever, the price movement shows a considerable correlation since the early March decrease. The price of both assets has gone in the same direction, even if the movements have had a larger magnitude in both directions in the case of BTC.
Therefore, while the decrease was exacerbated in the price of BTC, the ensuing recovery was also stronger. At the time of writing, the BTC price had increased by 10% since March 12, relative to only 1% for gold.
To conclude, the BTC and gold prices showed independent movement throughout the majority of 2020. However, their movement has been closely correlated since the rapid decrease that took place over March 11-13, solidifying the possibility that they are both considered as safe havens during times of uncertainty.
The post Analyzing Bitcoin’s Correlation to Gold Since the Recent Decrease appeared first on BeInCrypto.
origin »Golos Gold (GBG) на Currencies.ru
|
|


