2022-10-18 19:00 |
Aave (AAVE) price has been increasing since Oct. 13. The upward movement is expected to continue until at least $90.50 to $96.50 and possibly higher.
AAVE has been decreasing underneath a descending resistance line since reaching an all-time high price of $668 in May 2021. The downward movement has led to a minimum price of $45.60 in June 2022.
AAVE price has been increasing since and managed to break out from the line in July. However, it has yet to initiate an upward movement and is trading close to its pre-breakout levels.
While the breakout from such a long-term resistance line is a bullish sign, the weekly RSI has not moved above 50, nor has it generated any bullish divergence. So, it is unclear if the breakout will lead to a significant upward movement.
If an upward movement commences, the main resistance area would be between $255 to $285, created by a horizontal resistance and the 0.382 Fib retracement resistance level.
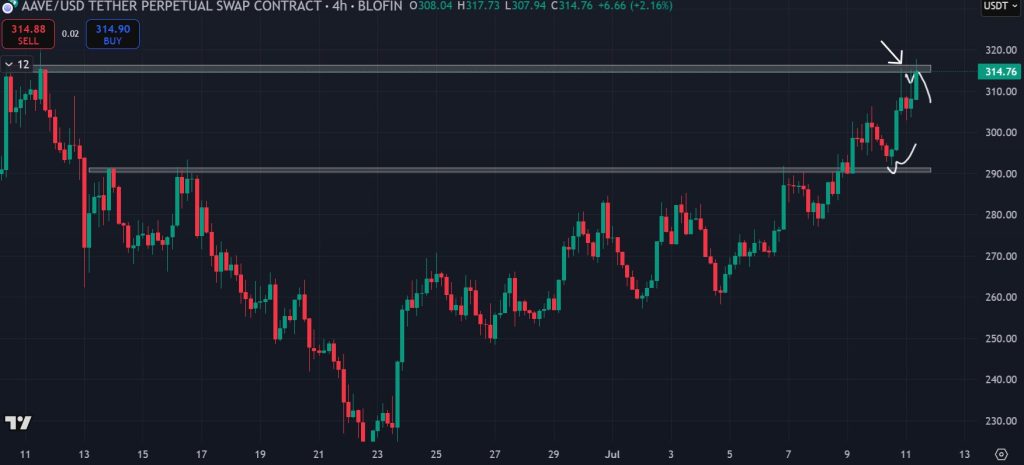
AAVE/USDT Chart By TradingView AAVE price holds strong despite negative newsOn Oct. 17, news hit that the address of Justin Sun has withdrawn roughly $50 million USDT from the Aave Protocol. He then transferred the money to an address funded by Poloniex.
Aave banned Justin Sun’s address after he received 0.1 ETH randomly from blacklisted cryptocurrency mixer Tornado Cash in Aug.
The total supply of USDT in the pool has now decreased to $250m, a drop of roughly 17%.
Source: TwitterDespite this seemingly negative news, the AAVE price has actually been moving upwards since creating a long lower wick on Oct. 13. The wick served to validate the $71 horizontal area as support.
Shortly afterward, AAVE price broke out from a descending resistance line that had been in place since Aug. 12.
The daily RSI is bullish, increasing the legitimacy of the breakout. It generated bullish divergence before the upward movement (green line) and has now moved above 50.
So, the most likely AAVE price prediction supports an upward movement towards at least the 0.5-0.618 Fib retracement resistance levels at $90.50 to $96.50.
AAVE/USDT Chart By TradingView AAVE price could push past $130In alignment with the technical analysis readings from the weekly and daily time frames, AAVE likely initiated a bullish reversal after its aforementioned June lows.
So, the ensuing decrease was part of wave B, while the breakout from the line confirmed that the correction is done.
It is not yet clear if the movement is part of a five-wave increase or is an upwards A-B-C corrective structure (black) instead. In any case, AAVE is expected to increase towards $135.50, since that would give waves A:C a 1:1 ratio.
The reaction once the price gets to $135 will likely determine this and the direction of the future price movement.
AAVE/USDT Chart By TradingViewFor BeInCrypto latest Bitcoin (BTC) analysis and crypto market analysis, click here
Disclaimer: BeInCrypto strives to provide accurate and up-to-date information, but it will not be responsible for any missing facts or inaccurate information. You comply and understand that you should use any of this information at your own risk. Cryptocurrencies are highly volatile financial assets, so research and make your own financial decisions.
The post AAVE Price Continues to Pump Despite Justin Sun Withdrawing $50M appeared first on BeInCrypto.
origin »Bitcoin price in Telegram @btc_price_every_hour
Aave (LEND) на Currencies.ru
|
|


