2019-5-22 18:10 |
Late May Update: Technicals
Daily ZRXBTC
ZRX is in a deep bear trend on the daily, witnessed by the positions and descending order of moving averages: EMA20, MA50 and MA200. It dropped from the local high of 8251 sats in April to the May 13-14th low at 3507 sats. Right now it is trying to claw back up to the Fib236 level at 4626 before it can aim at the breakout height of Fib382 at 5319.
4H ZRXBTC
You can see that on the 4 hour time frame, ZRX is stuck in a channel between 4k and 4.2k sats. The resistance at 4.6k is very strong as it is a confluence point of two Fib levels (April – May high lows and May-May high lows).
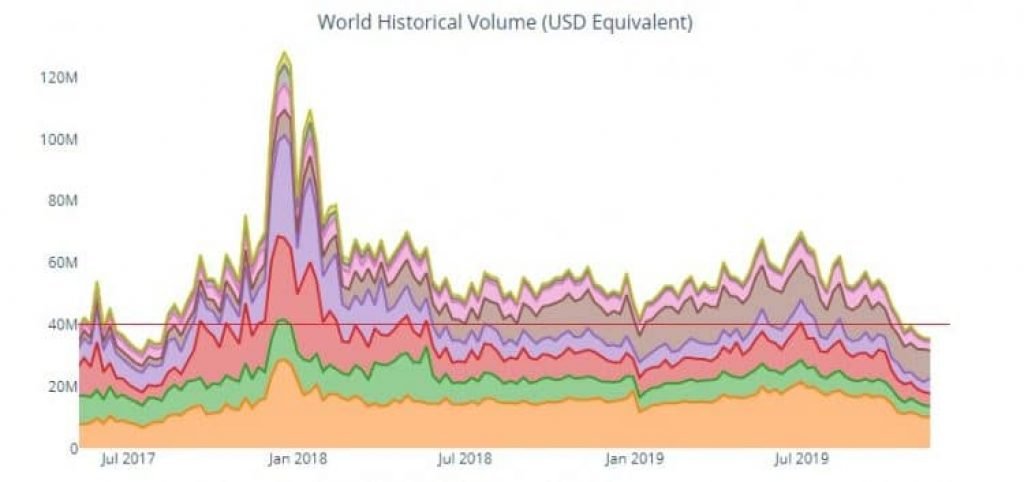
Trading volume and liquidityTrading volume is relatively low – reported volume in the last 24hrs was $22.8m and “Real 10” (trading volume on the exchanges that provably prevent wash trading) volume is 4.7x lower – $4.7m. This means that ZRX’s liquidity is moderately inflated and its trading volume is overstated by 4.7x which is comparatively great ratio.
Moreover, ZRX has a somewhat strong buy support, according to coinmarketbook.cc. Buy support is measuring sum of buy orders at 10% distance from the highest bid price. This way we can eliminate fake buy walls and whale manipulation and see the real interest of the market in a certain coin. In the last 24 hours, ZRX had a $1.7m of buy orders measured with this method, which sets ZRX buy support/market cap ratio at 0.94%, a wide-market above average value. Bitcoin and Ethereum had a 0.27% and 0.28% ratios, respectively. This novel metric indicates there are a lot of manipulations, inflated liquidity and fake orders on all crypto trading pairs, including ZRX pairs.
Late May Update: FundamentalsTo assess fundamental health of a project, we used the FCAS metric. FCAS is a comparative metric whose score is derived from the interactivity between primary project lifecycle fundamentals: User Activity, Developer Behavior, and Market Maturity.
There are a few sub components which provide data to each fundamental:
User Activity is comprised of Project Utilization and Network Activity
Developer Behavior is comprised of Code Changes, Code Improvement and Community Involvement
Market Maturity is comprised of Liquidity and Market Risk. Market Maturity has less than 5% impact on a project’s overall FCAS.
FCAS ratings are on a 0-1000 point scale with a corresponding letter grade. Break points are based on standard deviations in the underlying component distributions.
900 – 1000 is marked as S for superb. 750 – 899 is marked as A for attractive. 650 – 749 is marked as B for basic. 500 – 649 is marked as C for caution. And finally, below 500 is marked as fragile. You can read more about it here.
0x has been ranked as the A category – attractive with overall 863 points as of May 22nd. By far the strongest metric that contributed to this score is user activity that got 933 points, followed by developer activity with 849 and market maturity that had 601 points. This data backed fundamentals valuation model is a good insight into underlying driving forces of a project and as you can see ZRX fares excellent under the scrutiny of FCAS.
The post 0x (ZRX) Price Analysis And Prediction 2019 – Another Altcoin Stuck In Sideways Floating (May 22nd Update) appeared first on CaptainAltcoin.
origin »Bitcoin price in Telegram @btc_price_every_hour
Theresa May Coin (MAY) на Currencies.ru
|
|


