2021-11-12 22:07 |
0x (ZRX) initiated an upward movement on Oct 27 that culminated with a breakout from a long-term consolidation phase. As a result, it could increase considerably in the near future.
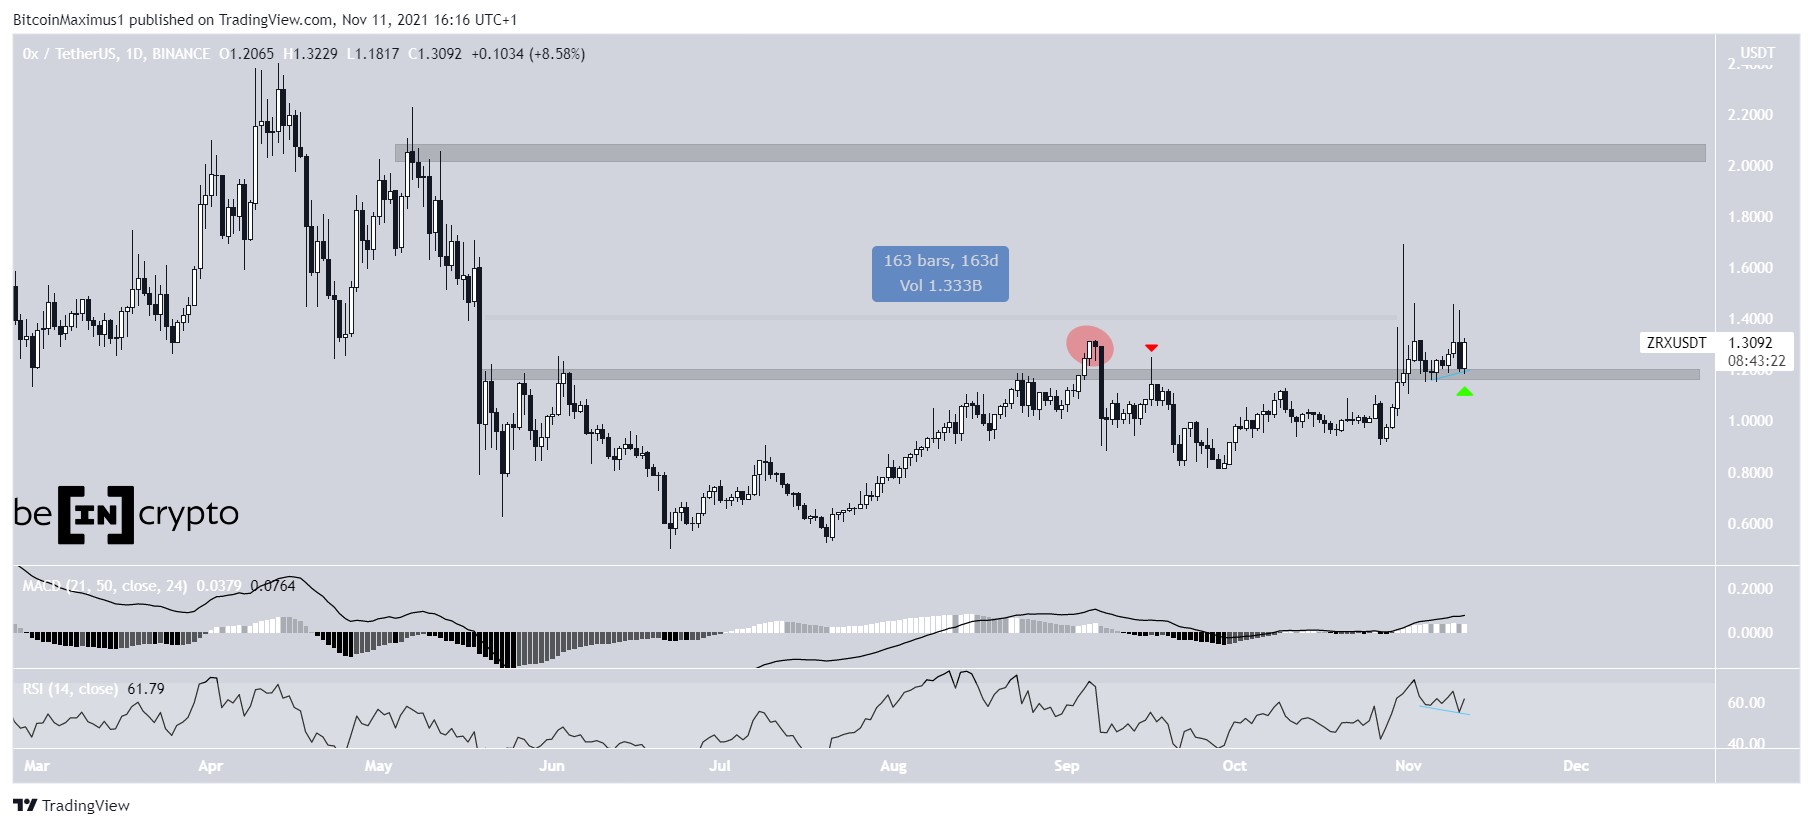
On Oct 30, ZRX broke out from the $1.18 horizontal resistance area. With the exception of a deviation on Sept 5 (red circle), ZRX had been trading below this area for 163 days. Since it fell below the area and even was rejected from it (red icon) a few days later, the resistance area remained valid. After the breakout, ZRX returned to validate the area as support (green icon) and bounced.
Breakouts from such long-term consolidation phases usually result in a sustained upward movement.
Furthermore, this possibility is supported by technical indicators.
The MACD, which is created by a short- and a long-term moving average (MA), is positive and moving upwards. This means that the short-term trend is faster than the long-term one.
The RSI, which is a momentum indicator, is above 50. This means that momentum is bullish. Furthermore, the indicator has generated hidden bullish divergence, which is a strong sign of trend continuation.
So, if ZRX continues to increase, the next closest resistance area would be at $2.05.
Chart By TradingViewCryptocurrency trader @Pentosh1 outlined a ZRX chart, stating that the breakout could take it to at least $1.72. The chart aligns with that presented above.
Source: Twitter Short-term movementThe shorter-term two-hour chart shows that ZRX is trading inside a symmetrical triangle. The triangle is considered a neutral pattern, meaning that both a breakout and breakdown are equally likely.
However, the triangle is transpiring after an upward movement. This makes a breakout a more likely outcome, since the symmetrical triangle usually acts as a continuation pattern.
Both the RSI and MACD support the continuation of the upward movement. The RSI has just moved above 50, while the MACD is positive and increasing.
Therefore, a breakout from the triangle seems likely.
Chart By TradingView ZRX/BTCUnlike the ZRX/USD pair, the ZRX/BTC is not yet decisively bullish.
The token is still following a descending resistance line, which has been in place since the beginning of Feb. More recently, it was rejected by the line on Oct 31.
While the RSI is above 50, the MACD is not yet positive.
Therefore, the correction cannot be considered complete until ZRX breaks out above these lines.
Chart By TradingViewFor BeInCrypto’s latest Bitcoin (BTC) analysis, click here.
The post 0x (ZRX) Breaks Out From 165-Day Resistance Area appeared first on BeInCrypto.
origin »0x (ZRX) на Currencies.ru
|
|

