2020-7-8 00:00 |
Throughout the month of June, there’s been a very high degree of correlation between the S&P500 (SPX) and Bitcoin (BTC).
The former is approaching a significant resistance area, while the latter has already reached its own resistance.
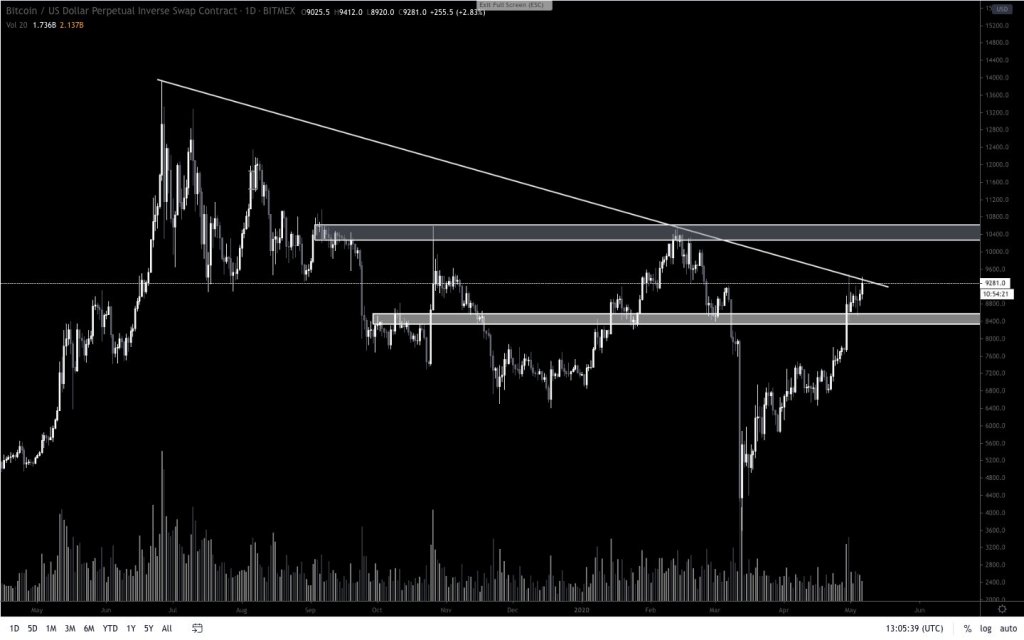
S&P500 Long-Term ResistanceA look at the weekly chart shows that the SPX is trading very close to the major $3,230 resistance area. The price reached this area during the week of June 8-15 and was rejected firmly, creating a bearish engulfing candlestick in the process.
It is currently making a second breakout attempt. If successful, the next resistance area is at $3,400. While volume has been low throughout this upward move, with one exception, it was at its highest during a bullish candlestick.
However, such an important resistance area will not break until volume has picked up considerably.
SPX Chart By Tradingview Current MovementThe daily chart gives a more bullish outlook. First, a bullish cross has already taken place between the 50 and 200-day moving averages, the former of which offers support to the price.
Also, yesterday’s bullish engulfing candlestick moved above an important wick resistance area from the past two weeks. This indicates that the price is likely to move upwards towards the previously outlined resistance area.
Once there, we’ll have to wait for bearish divergence on the RSI to confirm whether the price will break out and move towards $3,400, or create a double top and drop to the closest support area at $2,950. It seems that bearish divergence is the more likely outcome since the RSI is considerably lower than what it was on June 10.
SPX Chart By TradingviewThe daily chart shows that the price has already broken out from a descending resistance line and the $3,150 area, which previously acted as resistance. Furthermore, SPX is following a rising support line, which coincides with the previously mentioned support area.
As long as the price is trading above these two support levels, the price movement is bullish, and SPX should increase towards the previously mentioned resistance area.
SPX Chart By TradingviewCryptocurrency trader @ColdbloodShill outlined an SPX chart that shows the price trading inside a broadening triangle. The triangle is a very short-term occurrence, and based on our analysis, the price will break out.
Source: Twitter Correlation to BitcoinSince June 11, there has been a very high degree of correlation between Bitcoin and the SPX, as shown by the histogram at the bottom of the chart. Values of 1 indicate a perfect correlation.
While correlation went negative for two days on June 4-6, in which Bitcoin increased, but SPX decreased, it’s back into positive territory now.
The correlation has not always been high, as evidenced by the first ten days in June, in which it went negative for several periods.
SPX Chart By TradingviewThe post Will the S&P500 Rally Take Bitcoin Along for a Ride? appeared first on BeInCrypto.
origin »Bitcoin price in Telegram @btc_price_every_hour
Resistance (RES) на Currencies.ru
|
|