When Will DOGE Begin an Upward Move?

When Will DOGE Begin an Upward Move?
фото показано с : beincrypto.com

2020-4-15 19:12

During the first week of February, the DOGE price began a considerable upward move, at one point increasing by 40%. This caused a breakout from a long-term descending resistance line, supposedly initiating a new, long-term upward trend.

However, the DOGE price has barely moved since then, being seemingly stuck in a range. Throughout April, the number of daily transactions has begun to trend upward, approaching the highest levels since the first week of February, indicating that there is increased interest around the coin.

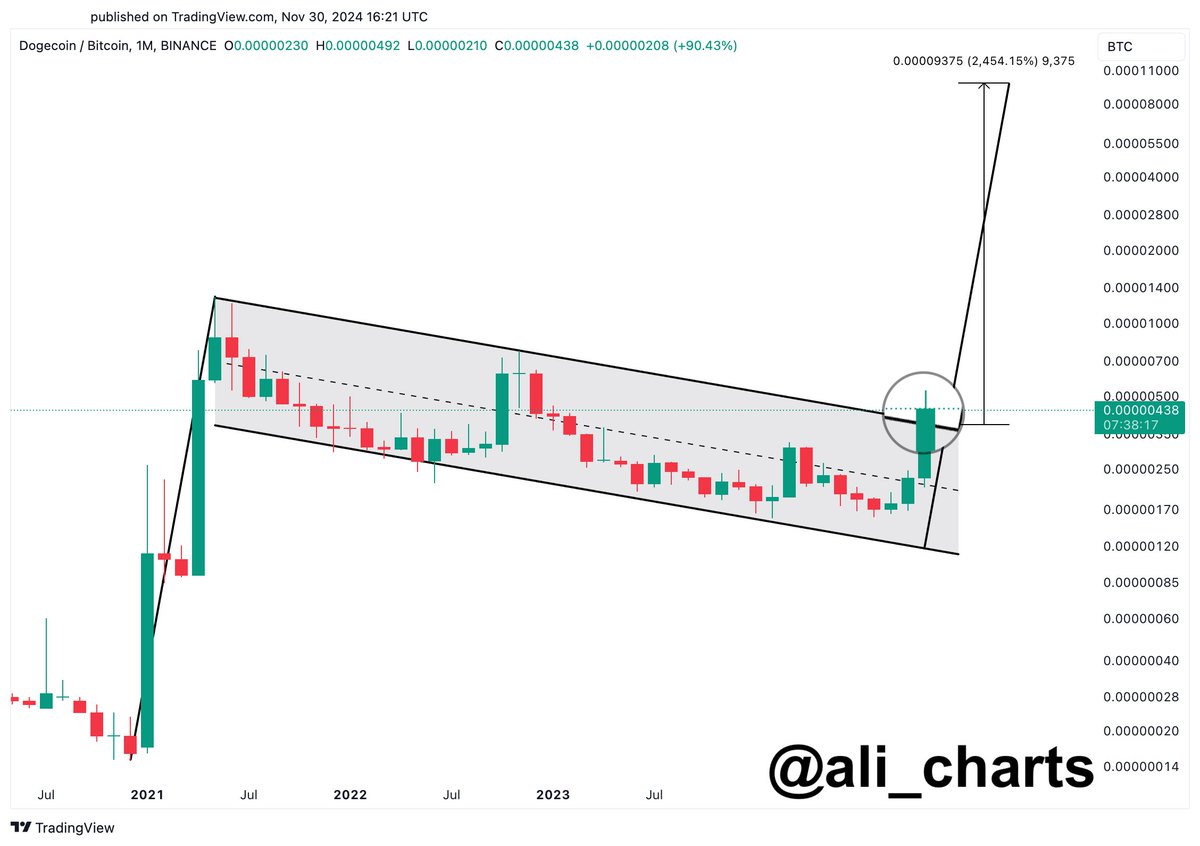
This has yet to have a positive effect on the price of the coin, as was evidenced when self-described “DOGE Maximalist” @Larousse____ tweeted a DOGE chart, expressing frustration that the price has not yet begun an upward move. Once it does, he has outlined quite a rapid increase in which the price reaches a high of 110 satoshis by the end of the year, which is more than three times higher than the current price.

Can we just absolutely send $DOGE already ffs pic.twitter.com/IC7e5qh31I

— Larousse ($DOGE MAXIMALIST) (@Larousse____) April 14, 2020

Will the DOGE price begin an upward move, and more importantly, will it reach the 110-satoshi target once it does so? Continue reading below if you are interested in finding out.

Resistance Breakout

In the beginning of February, the DOGE price broke out from a very long-term descending resistance line that had been in place for a total of 980 days. While movements outside of such long-term lines often result in a rapid continuation in the same direction, that has not yet occurred with DOGE.

The weekly RSI has been generating very considerably bullish divergence since July 2019, another sign that the price is likely to move upwards. If it does so, the closest resistance area is found at 80 satoshis.

DOGE Chart By Trading View The Price Is Range Trading

When looking at the DOGE price in the daily time-frame, it is visible that the price is trading in a range between 26 and 33 satoshis and has been doing so for the past 174 days. The movement inside this area has all the characteristics of a consolidation period inside a range:

The RSI is freely crossing above and below the 50 line. The price is crossing above and below the 200-day moving average (MA). The price has validated both the resistance and support levels numerous times.

Therefore until the price breaks out/down from this range, it is expected to move from support to resistance and vice-versa. Because of the movement above the long-term descending resistance line outlined in the previous section, the price is more likely to break out than down.

However, DOGE has not given any indications that it wants to begin an upward move. Therefore, it is possible that it continues trading inside the current range for a period of time.

DOGE Chart By Trading View

To conclude, the DOGE price has broken out above a long-term descending resistance line, indicating that it has begun a bullish trend. However, the price is still consolidating in anticipation of its future upward move. When/If the price begins an upward move, it is expected to find resistance at 80 satoshis.

The post When Will DOGE Begin an Upward Move? appeared first on BeInCrypto.

Similar to Notcoin - TapSwap on Solana Airdrops In 2024

origin »

Dogecoin (DOGE) на Currencies.ru

$ 0.1589 (+1.18%)
Объем 24H $1.885b
Изменеия 24h: -4.21 %, 7d: 5.51 %
Cегодня L: $0.1577 - H: $0.1685
Капитализация $22.948b Rank 8
Цена в час новости $ 0.0019292 (8136.57%)

upward move long-term doge breakout caused line

upward move → Результатов: 126


Фото:

How Bitcoin’s Current Upward Move Compares to Previous Bull Traps

The Bitcoin price has been increasing rapidly since reaching a low on March 13. At the time of writing, BTC is trading a full 94% above the aforementioned low of $3,760. Despite the massive increase, not everyone is convinced that BTC has already reached a bottom, One such individual is cryptocurrency trader @CryptoCapo_, who outlined […] The post How Bitcoin’s Current Upward Move Compares to Previous Bull Traps appeared first on BeInCrypto.

2020-4-10 18:11


Фото:

Bitcoin’s Price Action Resembles a Bearish Wyckoff Distribution

On March 20, the BTC price reached a high of $6,900. Since then, it has been mostly trading in a range between $6,100-$6,900, with the exception of a failed breakdown attempt on March 27. On April 2, the price initiated a rapid upward move and reached a high of $7,192, however, the higher prices could […] The post Bitcoin’s Price Action Resembles a Bearish Wyckoff Distribution appeared first on BeInCrypto.

2020-4-3 17:10


Фото:

Is Bitcoin Moving in an Ascending Triangle or Wedge?

On April 2, the Bitcoin price initiated a very swift upward move, rallying from a low of $6,551 to a high of $7,194. While initially, it seemed that this movement would cause a breakout above the current pattern, the higher prices could not be sustained and BTC reached a close of $6,794, slightly below the […] The post Is Bitcoin Moving in an Ascending Triangle or Wedge? appeared first on BeInCrypto.

2020-4-3 13:45


Фото:

Bitcoin Breaks Out Above Resistance — Is $8,000 Just Around the Corner?

On April 1, the Bitcoin price initiated an upward move that caused it to break out above its descending resistance line and with it the symmetrical triangle it had been trading in since March 20. Bitcoin Price Breakout Last night, the Bitcoin price broke out from the possible symmetrical triangle it has been trading in […] The post Bitcoin Breaks Out Above Resistance — Is $8,000 Just Around the Corner? appeared first on BeInCrypto.

2020-4-2 12:53


Фото:

Bitcoin Aims to Re-Test Important Weekly Support and Resistance Levels

During the week of March 16-23, the Bitcoin price increased significantly, at one point reaching a high of $6,900. However, it decreased considerably over the weekend. Since the price failed to reclaim this important resistance area, this week’s movement will likely see a bearish re-test of support, rather than the beginning of an upward move.

2020-3-23 17:10


Фото:

The FCT Price Could Increase by 9x in 2020

The FCT price could soon begin an upward move. If the previous price history is any indication, it will reach a high between 150,000-250,000 satoshis. On January 8, we posted a tweet outlining the top five projects to keep an eye on in 2020, which are: QNT OCEAN XTZ DAG FCT Here Are the Five […] The post The FCT Price Could Increase by 9x in 2020 appeared first on BeInCrypto.

2020-1-12 14:22


Фото:

An ATOM Decrease Below the Current Support Could End the Upward Trend

The ATOM price failed to break out above the 65,000 satoshis resistance area throughout December and began a downward move that is still ongoing. The price has reached a very significant support level and the ascending support line that has measured the rate of increase since the beginning of the upward movement on September 6, […] The post An ATOM Decrease Below the Current Support Could End the Upward Trend appeared first on BeInCrypto.

2020-1-9 10:44


Фото:

XRP Price Quickly Erases Gains Following Binance Futures Addition

The XRP price reached resistance on January 6 and has decreased by 15 percent since. On January 6, the XRP price initiated an upward move that caused it to increase by 15 percent. Interestingly, this occurred slightly prior to Binance’s announcement that it has launched leverage futures trading for the XRP/USDT pair, sparking accusations of […] The post XRP Price Quickly Erases Gains Following Binance Futures Addition appeared first on BeInCrypto.

2020-1-8 18:36