2021-5-19 23:50 |
Unifi Protocol Dao (UNFI) has been decreasing, since it reached an all-time high price of $44.39 on March 1.
However, it has reached a crucial support area and is trading inside a descending wedge, which is considered a bullish reversal pattern.
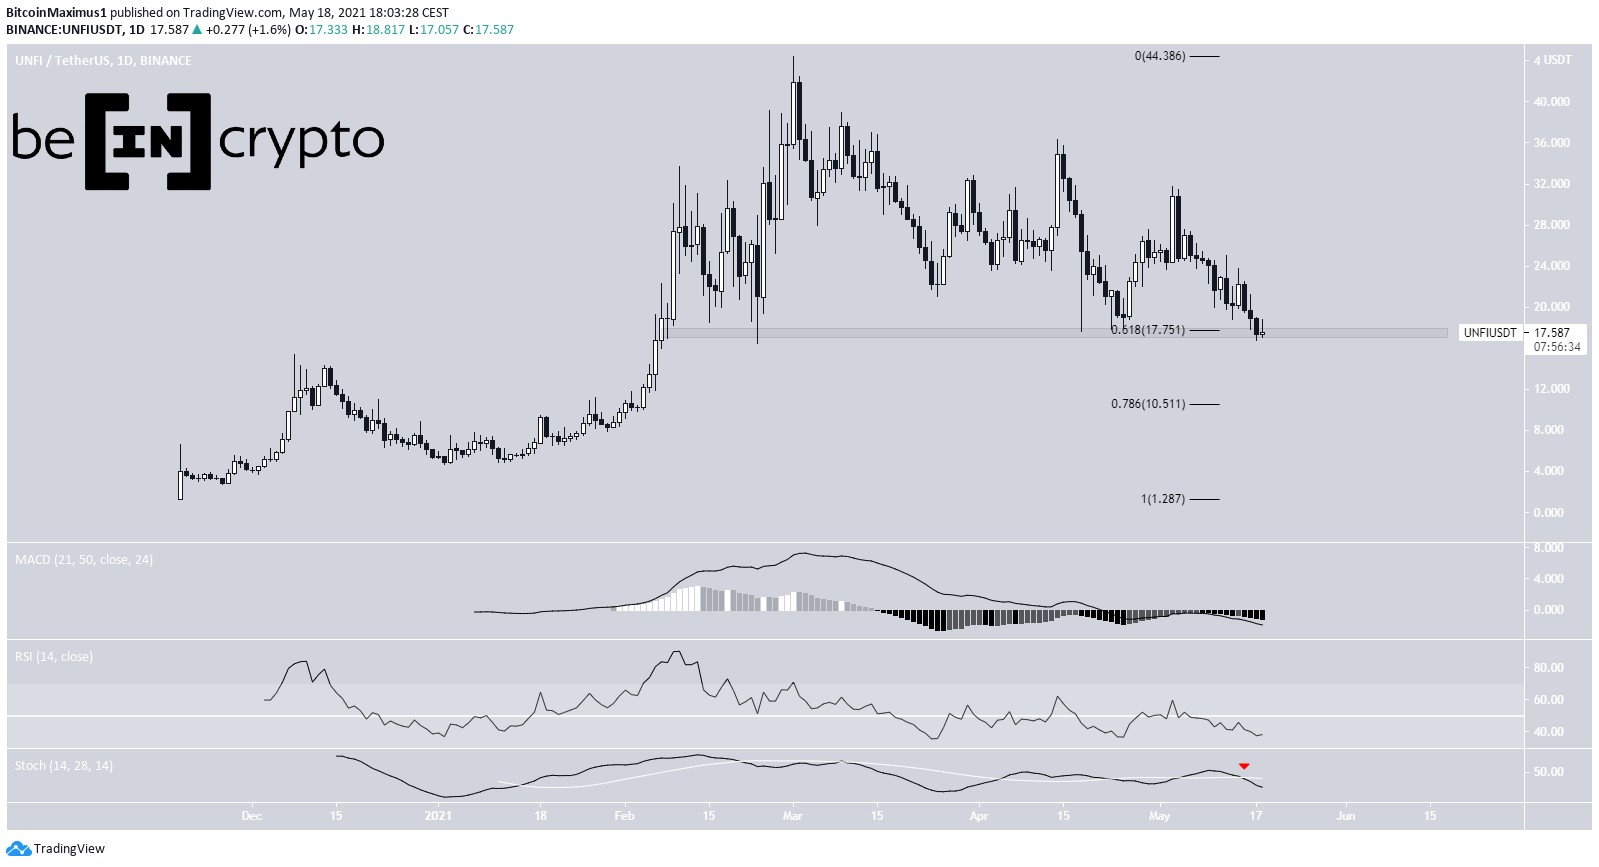
UNFI continues correctionUNFI has been moving downwards since March 1, when it reached an all-time high price of $44.39. The downward movement has been gradual and choppy.
Currently, the token is trading right above the $17.75 support area. This is the 0.618 Fib retracement level of the entire upward movement. UNFI has not traded below this level since Feb 15.
However, technical indicators are bearish. The MACD is decreasing, the RSI is below 50, and the Stochastic Oscillator has made a bearish cross.
If a breakdown occurs, the next support level would be found at $10.50. This is the 0.786 Fib retracement level of the same upward movement.
Chart By TradingView Future UNFI movementCryptocurrency trader @Thetradinghubb outlined an UNFI chart, stating that the token is approaching its preferred buy zone. The zone coincides with the $17.75 area outlined previously. Afterwards, a bullish reversal is expected.
Source: TwitterThe shorter-term six-hour chart supports the possibility of a bullish reversal. The token is trading inside a descending wedge, which is considered a bullish reversal pattern. In addition, both the RSI and MACD have generated bullish divergence. At the time of writing, the price was trading right at the support line of this pattern.
If a breakout occurs, the closest resistance area would be found at $33.65. This is the 0.618 Fib retracement level of the entire downward movement.
Chart By TradingView DeFi IndexThe DeFi index made a new all-time high of $3,847 on May 12. Similarly to UNFI, it has been decreasing inside a descending wedge since then.
In addition, it has bounced at the $3,050 support area.
Technical indicators are turning bullish. The RSI has generated bullish divergence, while the MACD is close to giving a bullish reversal signal.
Therefore, a breakout from the wedge is expected, which would likely take the index back to the $3,670 all-time high resistance area.
Chart By TradingViewFor BeInCrypto’s latest bitcoin (BTC) analysis, click here.
The post UNFI Attempts Reversal While DeFi Index Makes New Highs appeared first on BeInCrypto.
origin »Bitcoin price in Telegram @btc_price_every_hour
Defi (DEFI) на Currencies.ru
|
|