2018-12-28 14:49 |
Chart – Source: Tradingview.com
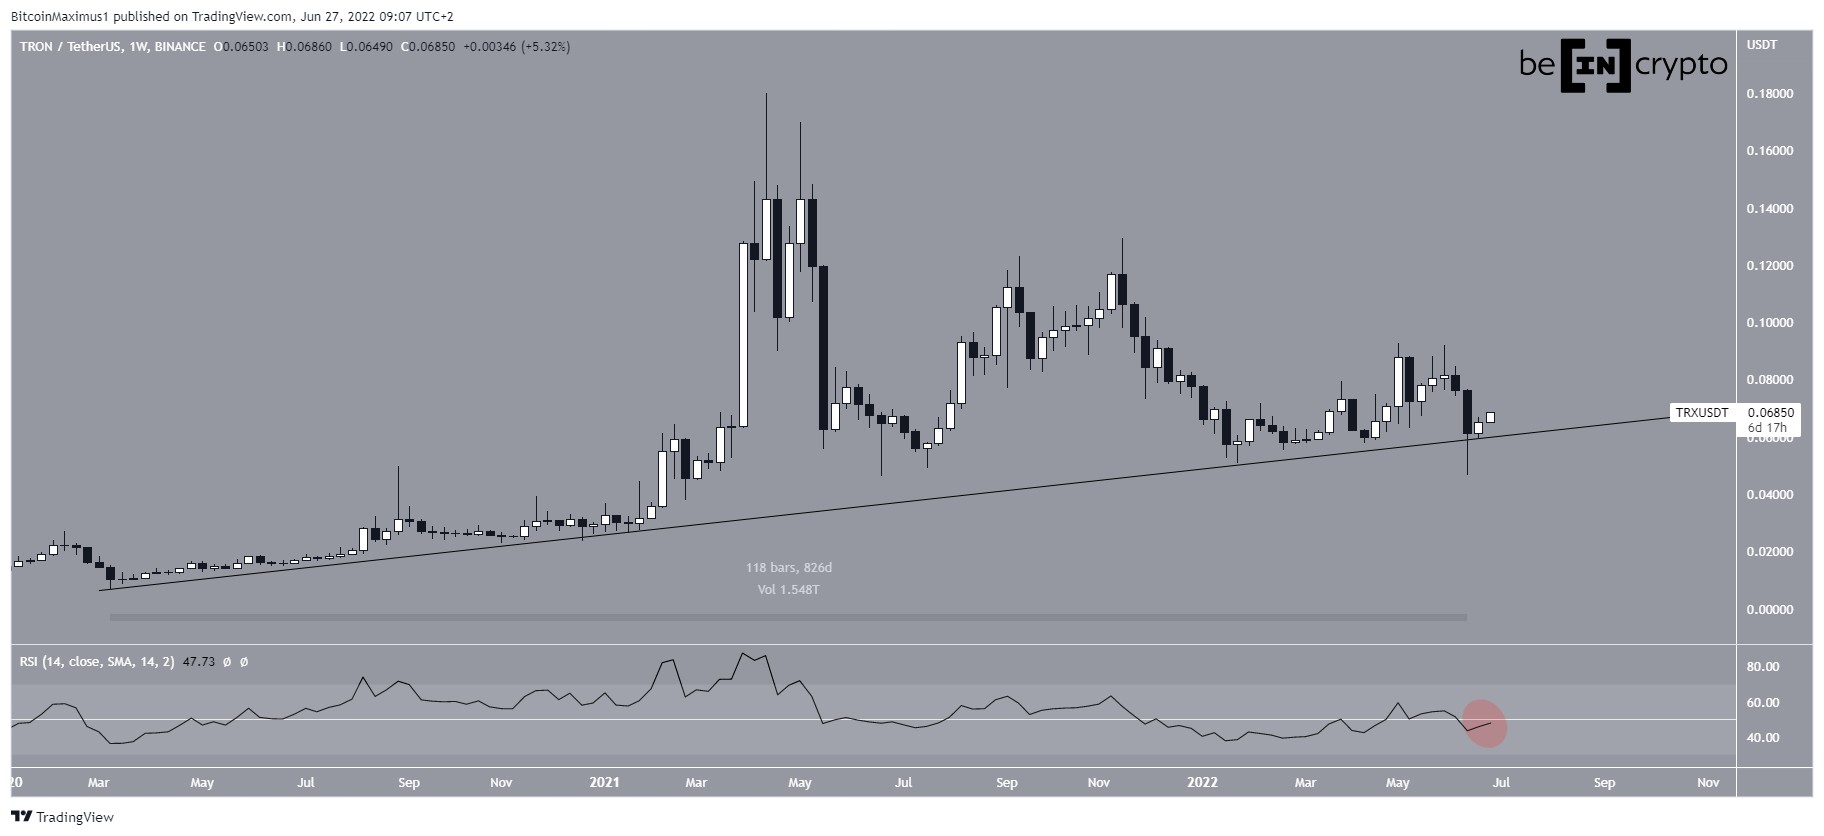
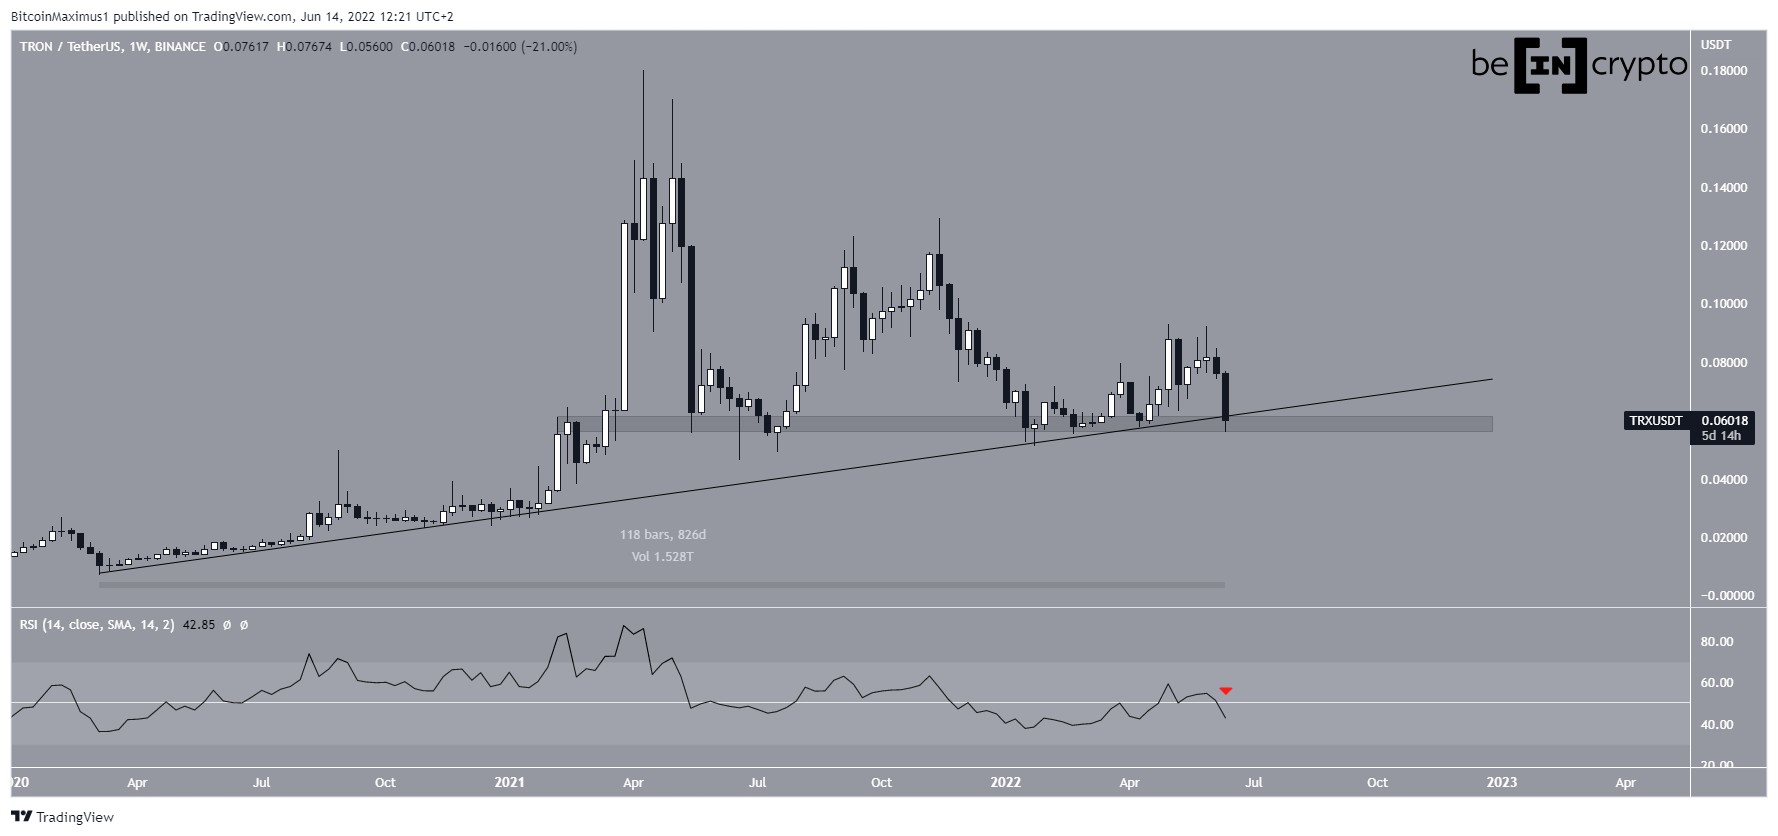
A look at the Weekly chart for Tron (TRX) shows that price has been following a falling support line.
The RSI is 40, indicating neither overbought nor oversold conditions.
The MACD recently made a bullish cross (yellow arrow) and is seemingly headed upward.
However, the price has found resistance at the 7-period moving average and is below the 7 and 21 period MAs.
Long-Term Outlook Chart – Source: Tradingview.comA look at the 3-day chart gives more information about where price might be headed.
There is a significant bullish divergence in both the MACD and Chaikin Oscillator, but none in the RSI. Price recently moved past the 7-period moving average, but quickly met resistance at the 21-period MA and retraced.
Price is below the 7,21,50 period MAs and the cloud.
Medium-Term Outlook Chart – Source: Tradingview.comA look at the Daily chart shows that price met resistance at the 200-period moving average close to $0.02 while trying to break the cloud and a small retrace ensued.
The RSI became overbought (>70), and while the MACD is still positive, it is steadily falling.
Short-Term Outlook Chart – Source: Tradingview.comFinally, a look at the 6-hour chart gives a clearer view of where price might be headed in the short-term.
After breaking the $0.017-$0.018 resistance, the price quickly developed bearish divergence with the RSI and returned to the previous resistance area, which is now acting as support.
If it were to break down, the next support area would be at $0.015.
Conclusions Long-term indicators are leaning on turning bullish. Price is trying to break the daily cloud. There is short-term support at $0.015. DISCLAIMER: Investing or trading in digital assets, such as those featured here, is extremely speculative and carries substantial risk. This analysis should not be considered investment advice, use it for informational purposes only. Historical performance of the assets discussed is not indicative of future performance. Statements, analysis, and information on blokt and associated or linked sites do not necessarily match the opinion of blokt. This analysis should not be interpreted as advice to buy, sell or hold and should not be taken as an endorsement or recommendation of a particular asset.TRON [TRX]: After the Rally, How Long Will the Short-term Retracement Last? was originally found on [blokt] - Blockchain, Bitcoin & Cryptocurrency News.
origin »Bitcoin price in Telegram @btc_price_every_hour
TRON (TRX) на Currencies.ru
|
|