2020-10-31 14:53 |
Bitcoin recently touched a high of $13,800, which is likely the peak of an upside parabola whose outlook suggests a correction to $12,300
While BTC/USD looks like holding above $13,000, a bearish flip to prices near $12,000 is likely if we consider the historically accurate upside parabola pattern.
Bitcoin’s recent jump to highs above $13,800 provided bulls with an opportunity to push prices above $14,000 — a resistance level many analysts see as the only one in the way of a rally to $20,000.
But a sharp sell – off on Wednesday saw BTC price drop to the support level at $13,000. Even though bulls managed to recover to highs of $13,500, the price is currently bound beneath the area. The short term outlook is still bullish, but a look at the upside parabola fractal shows that the prices could drop to lows of $12,000 before rebounding to hit highs near the ATH.
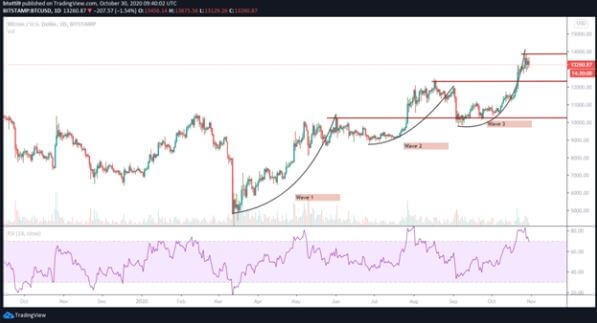
The fractal has formed on two occasions since BTC/USD crashed to lows of $3,800 in March, with the ‘third wave’ underway.
The fractal simply indicates the action that follows a parabolic rally, with the price falling to a support level before a sideways trading phase. The price takes flight again, with the previous peak as the new resistance level. A consolidation period underneath the level gives way to another rally, with the resistance level becoming the new support zone.
At the moment, Bitcoin is looking at ‘wave three’ if we go by this fractal.
This means that BTC can still rise to highs above $13,500, and test resistance at $13,800 — $14,000. However, a rejection at these levels will likely lead to a huge 10% retracement to the previous wave’s peak.
As noted above, the area provides the support that the bulls need to absorb the bearish pressure and form a base for the next bounce.
Going by the last two waves, and if history were to repeat itself, for BTC/USD, that area is around the $12,300 price level as indicated in the chart below.
Bitcoin price action chart showing upside parabola is now on ‘wave 3’. Source: TradingViewIf BTC/USD finds the suggested support level, a period of consolidation will allow the bulls to buy the dip and target a rebound above $13,800. The next wave should see the current resistance area for Bitcoin develop into the new support area which will allow the buyers to aim for the moon.
Bitcoin is currently trading around $13,274, with the technical picture on the 4 – hour and hourly timeframes suggesting a further retracement.
The post This fractal pattern suggests Bitcoin could dump to $12,000 appeared first on Coin Journal.
origin »Bitcoin price in Telegram @btc_price_every_hour
Bitcoin (BTC) на Currencies.ru
|
|