This Bitcoin (BTC) Fractal Could Drive Price to $390,000

This Bitcoin (BTC) Fractal Could Drive Price to $390,000
фото показано с : beincrypto.com

2021-10-16 14:11

Bitcoin has approached the $60,000 level and is back in the area of its all-time high (ATH) set in April 2021. Based on a fractal analysis of charts of previous BTC cycles, the peak prediction for the ongoing bull market even reaches the vicinity of $390,000.

Cryptocurrency and Bitcoin market analyst, @TechDev_52 has tweeted a series of charts on the possibility of future long-term movement of BTC. They show bullish predictions for the price of the alpha cryptocurrency for the next few months, especially at the end of this year.

In addition, the analyst used Fib levels to depict the potential bottom of a future bear market. Finally, he pointed out the similarities between the 1970s gold chart fractal and today’s Bitcoin price action.

Bitcoin’s fractal and Q4 pump

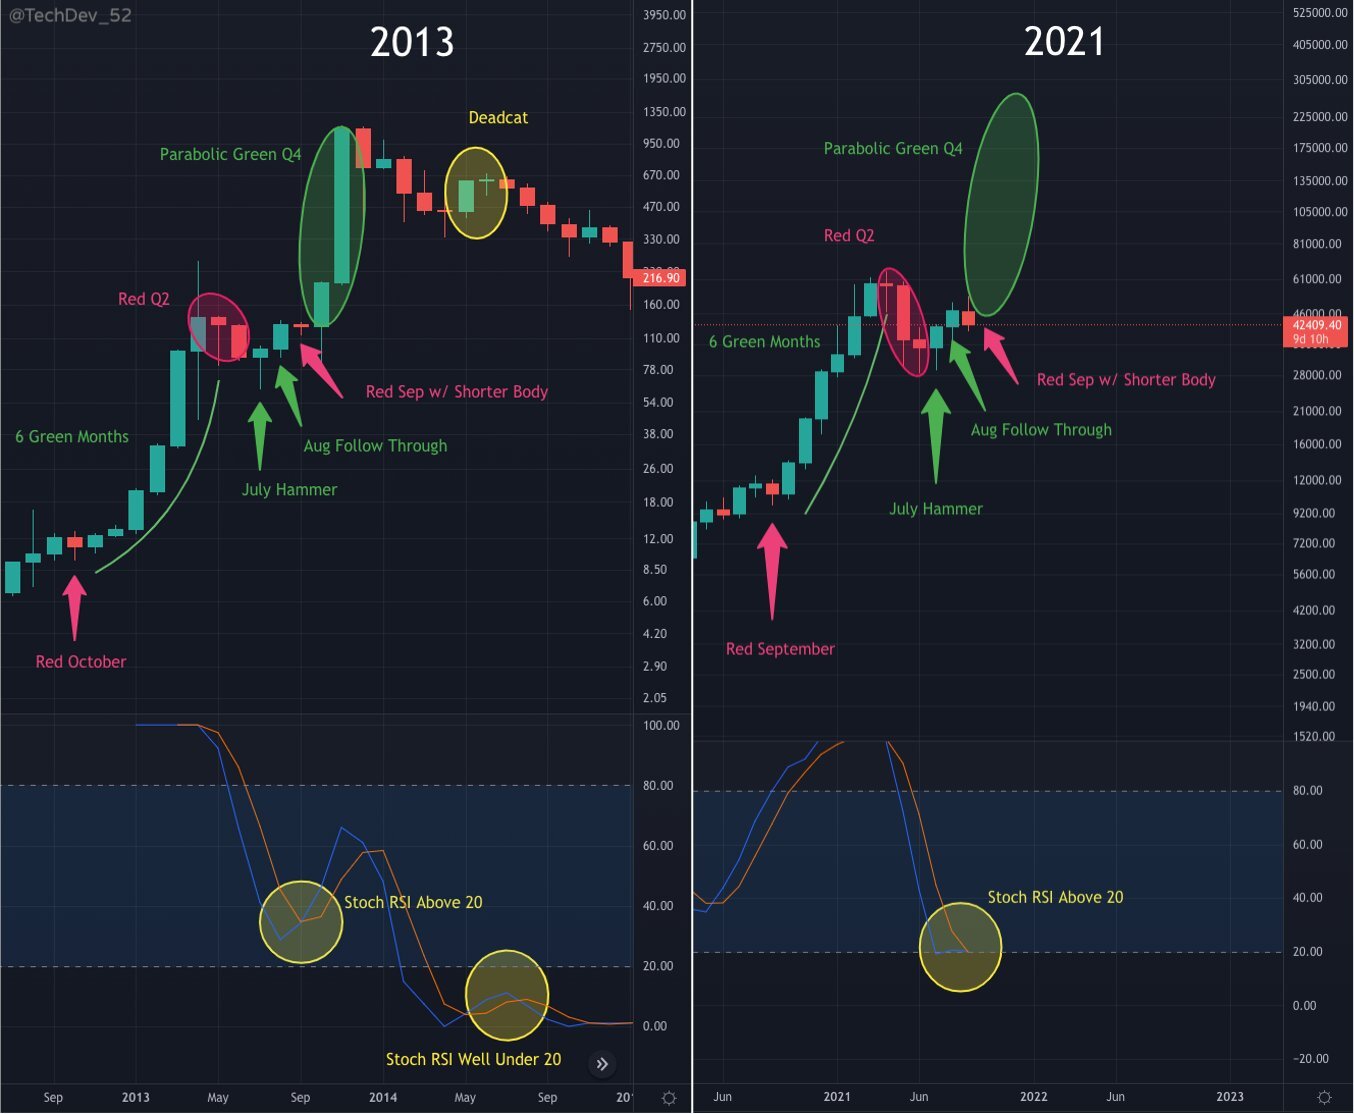
The first chart published by TechDev looks at the fractal structure of the monthly BTC chart. It compares the price action from the 2013 bull market with the current 2021 rally. It turns out that the monthly candles are very similar – both in terms of their alignment with each other and when comparing their shapes.

Source: Twitter

The start of the bull market in both cases was a red candle at the turn of the third and fourth quarters. This was followed by parabolic uptrends that led to 6 consecutive green monthly candles.

In the next stage, there was a correction (red circle) in the second quarter. It ended with a bullish hammer candle in July and a continuation of the increases in August. This was followed by a red candle in September, which historically has been a very bearish month.

What happened next was a parabolic rise for the last 2 months of 2013, which ended with a historical ATH at $1163. If this Bitcoin fractal were to continue, the end of 2021 could take the price into the $200-300k range.

Peak projection at $390,000

An even more bullish prediction is provided by the second of the published charts. It shows an analysis of Bitcoin’s potential fractal rise based on the bi-weekly RSI. TechDev points out that in both of the previous bull markets of 2013 and 2017, “the run after mid-cycle dip moved 30% per biweekly RSI.”

Source: Twitter

According to the analyst, if this Bitcoin fractal were to repeat itself, there is a theoretical possibility of a peak at $390,000. This analysis is further reinforced by the long-term trendline on the bi-weekly RSI (green), which has been in place since the first BTC cycle. However, he realistically admits:

“Do I think we get this high? No. But the consistency is interesting and shows we have tons of room to run.”

Bear market bottom

Another interesting chart shows a bottom prediction for a future bear market. The beginning of a macro downtrend is expected after the peak in the coming months. It turns out that the level to which the price of BTC can fall in the next few years is the area where it is currently located: $47-60k.

Source: Twitter

To determine this level, TechDev again uses Bitcoin’s historical fractal. He superimposes a long-term Fib retracement level on a logarithmic chart of BTC measuring from the absolute peak of each cycle to the absolute bottom.

It turns out that for the previous two cycles, the bottom of the subsequent bear market always reached the range of the 1.486-1.618 Fib external retracement. If this were to happen in the future as well, the $47-60k area would be reached after an 80-85% decline from the ATH of this bull market. A simple mathematical calculation shows that the peak of this bull market would have to be reached in the $235-315k range.

Gold’s ridiculous fractal

Finally, our analyst also points out the similarities that the current Bitcoin fractal exhibits with the gold price chart from the 1970s. Although the two charts correspond to different time frames, it is hard not to notice the numerous similarities. TechDev admits with disarming frankness that “now it’s just getting ridiculous.”

Source: Twitter

Interestingly, the Bitcoin price prediction based on the gold fractal remains within the ranges shown above for the bull market peak. Moreover, this calculation stays consistent with another TechDev chart, in a comment on which the analyst wrote: “200-300K #Bitcoin looks almost too programmed.”

This chart also uses the 2.272 Fib external retracement to estimate the top of this BTC bull market. It also uses the historical gold fractal (blue line). Even the market capitalization of both assets agrees. At the time, the total value of gold reached $1.2 trillion. Almost exactly the same as Bitcoin’s market capitalization today.

Source: Twitter

For BeInCrypto’s latest Bitcoin (BTC) analysis, click here.

What do you think about this subject? Write to us and tell us!

The post This Bitcoin (BTC) Fractal Could Drive Price to $390,000 appeared first on BeInCrypto.

Similar to Notcoin - Blum - Airdrops In 2024

origin »

Bitcoin (BTC) на Currencies.ru

$ 97633.93 (+0.55%)
Объем 24H $99.061b
Изменеия 24h: 3.64 %, 7d: 9.39 %
Cегодня L: $94006.77 - H: $98156.69
Капитализация $1932.282b Rank 1
Цена в час новости $ 60331.2 (61.83%)

bitcoin 390 btc fractal charts previous analysis

bitcoin 390 → Результатов: 35


Фото:

Analyst: Ethereum Could Rally Towards $432 if Bulls Flip One Key Level

Ethereum has continued seeing lackluster price action while Bitcoin rallies past its critical short-term resistance The crypto is on the cusp of flipping its $390 resistance, however, which could give it freedom to rally significantly higher in the short-term One trader is now noting that a surge up towards $432 could be in the cards if ETH can break above its short-term resistance level This would be a significant rally that potentially puts a firm […]

2020-11-1 22:00


Фото:

Ethereum Could See Major Weakness if Bulls are Unable to Defend Key Level

Ethereum has seen some immense strength over the past few days, with bulls pushing it as high as $395 before it faced some intense selling pressure that slowed its ascent The cryptocurrency has been unable to garner any significant buying pressure above $390, likely due to Bitcoin’s position beneath its $11,000 resistance Once the benchmark cryptocurrency breaks through, it may create a tailwind that lifts ETH higher The recent launch of Uniswap’s UNI token seems to […]

2020-9-19 23:00


This Support May Launch Ethereum to $500, But Signs of Weakness Remain

Ethereum has seen a strong rebound from its daily lows. This has allowed it to climb into the $390 region This upsurge came about in tandem with that seen by Bitcoin and most other major cryptocurrencies This market-wide movement has allowed cryptocurrencies that were battered by yesterday’s downturn to erase virtually all of their recent losses For ETH, one analyst is now setting his sights on a movement up towards $500 in the near-term That […]

2020-8-29 23:00


Ethereum Still Likely to Dive to $360 Support as Funding Stays Neutral

Ethereum and Bitcoin have both posted notable rebounds after facing some intense weakness throughout the early morning hours ETH was able to rally from lows of $380 to highs of well over $390, while Bitcoin pushed back above $11,500 after dipping to $11,200 This strength is an incredibly positive sign for the market, as it shows that buyers still have underlying strength Despite this strength, analysts are still short on Ethereum, with one trader noting […]

2020-8-28 23:00


Фото:

This Fractal Suggests Ethereum May Rally Past $500 Before Plunging Lower

Ethereum is struggling to maintain the slight momentum it found yesterday after its price reeled down to lows of $370 After bouncing up towards $390, bulls started facing faltering momentum that ultimately led the asset’s price back down towards sub-$380 Because Bitcoin is currently expressing signs of weakness, it remains incredibly unclear as to where the market may trend in the near-term One analyst is pointing to a strikingly accurate fractal for guidance, which shows […]

2020-8-27 23:00


Фото:

Cryptocurrency News Roundup for July 28, 2020

After trading sideways in the range between $9,000 and $10,000 for nearly two months, Bitcoin suddenly woke from its slumber on Monday and recorded an 11-month high around $11,390. Along with the sudden increase in price came the usual speculations surrounding an imminent massive rally, possibly taking the BTC/USD pair to an all-time high over […] The post Cryptocurrency News Roundup for July 28, 2020 appeared first on BeInCrypto.

2020-7-29 23:15


Фото:

‘Bullish For Bitcoin’: China Bank Bailouts Spark ‘Biggest Credit Bubble In History’

Bitcoin could possible gain from economic uncertainty in China as one source describes the country’s third major bank bailout of 2019 as the world’s “biggest credit bubble. ” China Bailouts: 3 Banks, $390 Billion Taking statistics from various sources, the Twitter cryptocurrency trader and commentator known as CryptoArbitrage noted that last week’s bailout of Heng Feng bank was the third involving assets over $200 billion.

2019-8-15 15:34


Bitcoin продолжает свой постепенный рост

Из нейтральной динамики, которую сначала демонстрировал Bitcoin, его вывели азиатские инвесторы, что позволило криптовалюте вернуться в центр текущей области. На данный момент Bitcoin находится в области $6 390, но есть все тенденции для роста, что говорит о выходе из продолжительной ценовой зоны.

2018-11-4 14:10


Фото:

Торговый оборот bitcoin-фьючерсов на CME достиг рекордных показателей

Во вторник, 24 июля, на Чи­каг­ской то­вар­ной бирже (CME) было заключено рекордное количество сделок с bitcoin-фьючерсами — 12 878 кон­трак­тов. Объем торгов составил 64 390 bitcoin, что условно составило $530 млн.

2018-7-26 14:32


CME Group: объем торгов биткоин-фьючерсами достиг рекордных значений

Во вторник, 25 июля, средний дневной объем торгов биткоин-фьючерсами на Чикагской товарной бирже (CME Group) составил 12 878 контрактов. Пока это является абсолютным рекордом, достигнутым на этой площадке торговцами криптовалютных деривативов.

2018-7-26 22:56