2026-8-6 14:00 |
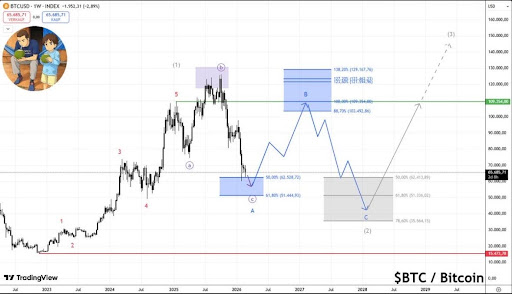
Bitcoin price remains under pressure, but Crypto Patel believes the current weakness could become the opening chapter of a much larger 5 year cycle. His roadmap does not call for an immediate rise to new records. It first places BTC much lower before a recovery carries the asset through several ambitious targets.
The prediction follows a repeating Bitcoin pattern that has appeared near previous market bottoms. However, one major price level could force Crypto Patel to abandon his bearish view much earlier.
Crypto Patel based his Bitcoin price prediction on declines recorded during earlier cycles. BTC dropped around 65% during 2015, 60% during 2019, and 69% during 2022.
Those major bottoms arrived approximately 47 months apart. The timing places his next possible bottom window between 2026 and 2027 if the same cycle continues.
Crypto Patel remains bearish as long as Bitcoin price stays below $82,818. A higher timeframe close above that level would change his position and weaken the case for another deep correction.
His proposed Bitcoin roadmap follows this sequence:
$64,000 to $80,000, followed by $30,000 to $35,000, then $150,000, $250,000, $300,000, and eventually $400,000.
@CryptoPatel / XThat sequence covers several years rather than a single market move. Crypto Patel expects BTC to remain inside the $64,000 to $80,000 region before another major decline begins.
The $30,000 to $35,000 zone represents his preferred accumulation region. He expects Bitcoin price to begin its next major expansion from that area if the historical cycle repeats.
Crypto Patel plans to focus on spot Bitcoin rather than leverage because his analysis covers a 4-year period. His roadmap remains a personal market model, and each target depends on Bitcoin following a similar cycle once again.
Bitcoin Price Must Recover $82,818 to Weaken the Bearish RoadmapA look at Crypto Patel’s roadmap shows that $82,818 acts as the main invalidation level. Bitcoin does not need to reach $30,000 if buyers reclaim that barrier first.
A higher timeframe close above $82,818 would show that BTC has recovered an important part of its previous structure. Crypto Patel would then change his bearish position because the expected decline would lose its main technical basis.
Continued rejection below that level keeps the deeper correction possible. Bitcoin price could first move through the $64,000 to $80,000 range before sellers test lower support.
The prediction becomes far more bullish after the proposed bottom. Crypto Patel places the first major recovery target at $150,000. Later stages point toward $250,000, $300,000, and $400,000 across the next 5 years.
Those larger targets require a complete market recovery and several successful breakouts. They should therefore be viewed as parts of a broader cycle map rather than immediate Bitcoin price destinations.
Monthly Bitcoin Indicators Remain Divided Between Buyers and SellersThe monthly technical readings provide no clear agreement about Bitcoin’s next major direction. Some indicators support a recovery, whereas others keep the risk of lower prices open.
IndicatorValueActionRSI (14)53.2NeutralMACD (12, 26)123.4BuyADX (14)29.004SellUltimate Oscillator54.096BuyBull Bear Power (13)minus 66.3826SellThe RSI stands at 53.2, which places Bitcoin slightly above the neutral midpoint without confirming strong bullish pressure. MACD carries a buy action and supports the possibility of another upward move.
The Ultimate Oscillator also gives a buy reading at 54.096. However, ADX carries a sell action at 29.004, and Bull Bear Power remains negative at minus 66.3826.
These mixed readings explain why Bitcoin price could still move in either direction. Buyers have enough strength to preserve the recovery case, but sellers have not lost control of the broader risk.
Read Also: Kaspa (KAS) Price Weakness May Be Hiding This Bigger Bullish Setup
Another Bitcoin Price Model Places Major Support Near $40,000An earlier analysis today presented another cautious Bitcoin price outlook. That model follows a rising trend line that has guided Bitcoin’s broader market structure since 2019.
BTC produced major reactions around the same trend line during 2020 and 2022. Those rebounds later developed into large rallies, and some eventually carried Bitcoin toward new all time highs.
BTC Price Chart Showing a Long-Term Pattern / TradingView.comCurrent Bitcoin price remains almost 50% above that historical support line. BTC could therefore fall further before reaching the area that supported previous recoveries.
The model places a possible Bitcoin bottom near $40,000 or slightly below it. Smaller declines could appear first before a deeper test develops if buyers fail to protect the current range.
Crypto Patel’s $30,000 to $35,000 target sits below that trend line estimate. Both analyses still share the same central idea. Bitcoin price may need a deeper correction before its next large bullish phase can begin.
FAQs {"@context":"https:\/\/schema.org","@type":"FAQPage","@id":"https:\/\/captainaltcoin.com\/this-analysts-massive-bitcoin-price-prediction-maps-out-the-next-5-years\/","mainEntity":[{"@type":"Question","name":"What is Bitcoin (BTC) used for?","acceptedAnswer":{"@type":"Answer","text":"Bitcoin can be bought, sold, mined, used for payments, or held as an investment. Bitcoin's limited supply is one reason some investors compare it to digital gold. Bitcoin is highly volatile and carries investment, security, and regulatory risks."}},{"@type":"Question","name":"How does Bitcoin work?","acceptedAnswer":{"@type":"Answer","text":"Bitcoin works as digital money using a shared public list, a network of computers, and strict math rules instead of a bank. Three key parts make it run: the blockchain ledger, peer-to-peer sending, and mining validation."}}]} What is Bitcoin (BTC) used for?Bitcoin can be bought, sold, mined, used for payments, or held as an investment. Bitcoin’s limited supply is one reason some investors compare it to digital gold. Bitcoin is highly volatile and carries investment, security, and regulatory risks.
How does Bitcoin work?Bitcoin works as digital money using a shared public list, a network of computers, and strict math rules instead of a bank. Three key parts make it run: the blockchain ledger, peer-to-peer sending, and mining validation.
Subscribe to our YouTube channel for daily crypto updates, market insights, and expert analysis.
The post This Analyst’s Massive Bitcoin Price Prediction Maps Out the Next 5 Years appeared first on CaptainAltcoin.
origin »Bitcoin price in Telegram @btc_price_every_hour
ETH/LINK Price Action Candlestick Set (LINKETHPA) на Currencies.ru


|