2022-10-31 17:00 |
The Solana (SOL) price might have completed both long- and short-term corrective patterns. If the ongoing breakout manages to reclaim the $37.60 area, the rate of increase could accelerate further.
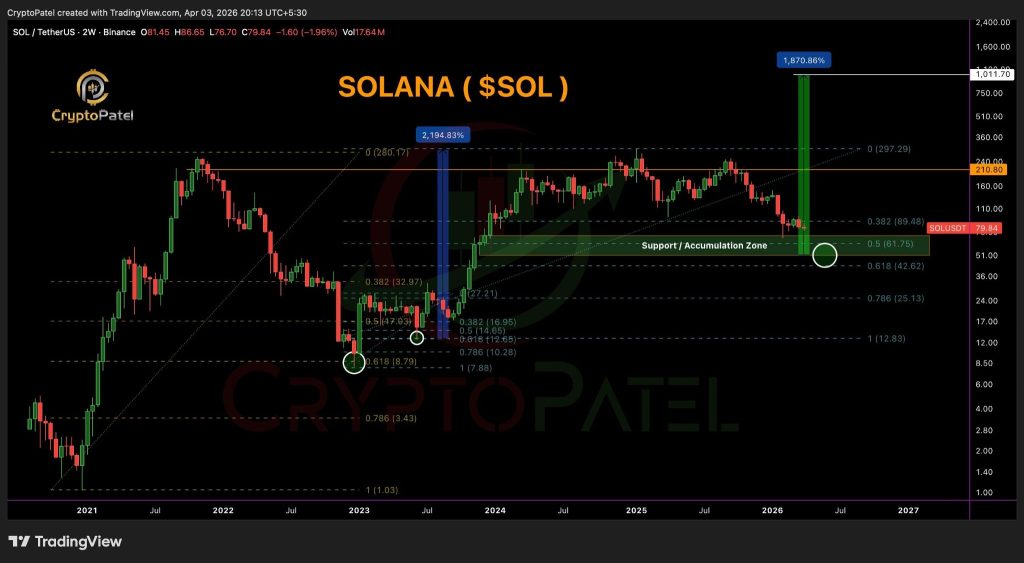
The technical analysis for the weekly time frame shows that the Solana price has been decreasing since reaching an all-time high price of $259.90 in Nov. 2021.
The movement since the all-time high resembles a completed long-term A-B-C correction (black). In it, waves A:C had an exactly 1:1.61 ratio.
Besides the wave count, the weekly RSI provides a bullish outlook. The indicator has both generated bullish divergence (green line) and broken out from a bearish trend line (black line).
As a result, the weekly time frame provides a bullish SOL price prediction.
SOL/USDT Chart By TradingView Solana Price Prediction: Breakout Will Lead to New HighsThe Solana price had been falling underneath a descending resistance line since reaching a high of $48.38 on Aug. 13. The decrease led to a low of $26.84 on Oct. 21.
Solana reversed trend shortly afterward and broke out from the line on Oct. 25. The entire downward movement looks like a completed A-B-C correction (black), in which waves A:C had a 1:0.618 ratio. This is the second most common ration in such structures.
If the upward movement continues, the closest resistance would be at $37.60. This is the 0.5 Fib retracement resistance level and a horizontal resistance area. A breakout above it would greatly accelerate the rate of increase.
The fact that the Oct. 21 low was slightly higher than that of June still allows for the possibility that the trend reversed in June.
However, a decrease below the $26.84 low (red line) would invalidate this bullish Solana price prediction and instead suggest that new lows are on the horizon.
SOL/USDT Chart By TradingView Short-Term Retracement Will Lead to Long-Term ReversalBoth the weekly and daily charts provide a bullish outlook, indicating that the upward movement is expected to continue.
However, the shorter-term two-hour chart suggests that an initial retracement is likely.
It seems that Solana has completed a five-wave upward movement. Additionally, there is a bearish divergence (green line) developing over the past 24 hours.
So, it is possible that the price will fall towards the 0.382-0.5 Fib retracement support area between $30.60-$31.50 prior to the resumption of the upward movement.
SOL/USDT Chart By TradingViewFor the latest BeInCrypto Bitcoin (BTC) and crypto market analysis, click here
Disclaimer: BeInCrypto strives to provide accurate and up-to-date information, but it will not be responsible for any missing facts or inaccurate information. You comply and understand that you should use any of this information at your own risk. Cryptocurrencies are highly volatile financial assets, so research and make your own financial decisions.
The post Solana (SOL) Price Prediction: Here’s Why $50 Is Closer Than You Think appeared first on BeInCrypto.
origin »Bitcoin price in Telegram @btc_price_every_hour
Solana (SOL) на Currencies.ru
|
|