2023-9-19 17:00 |
The Solana (SOL) price bounced last week, validating the $18 area as a long-term horizontal support.
While the weekly timeframe readings are bearish, the daily timeframe shows several bullish signs, indicating that an eventual breakout is likely.
Solana Price Bounces at Range LowThe weekly time frame technical analysis shows that SOL broke out from a long-term descending resistance line in July, reaching a new yearly high of $32.13 the same month. However, the price has fallen since, validating the $28 area as resistance.
The decrease culminated with a low of $17.33 in September. The ensuing bounce (green icon) supported the $18 horizontal area.
SOL/USDT Weekly Chart. Source: TradingViewThe weekly RSI is bearish. Traders use the RSI as a momentum gauge to evaluate if a market is in an overbought or oversold condition and make decisions about buying or selling assets. When the RSI reading is above 50, and the trend is upward, it indicates an advantage for bullish traders. Conversely, when the reading is below 50, the situation favors bearish traders.
The RSI deviated above 50 in July and is currently in the process of validating the line as resistance (red icon).
Check Out the Best Upcoming Airdrops in 2023
If the price increases towards its range high of $38, it could increase by 36%. However, if a breakdown below the $18 area transpires, SOL can fall to the descending resistance line at $13.
Anatoly Yakovenko, the co-founder of the Solana network, has urged the US government not to wait for perfect regulations to boost innovation. This comes at a time when a court has approved FTX’s list of crypto assets to be liquidated. In it, the exchange has declared $1.16 billion in SOL tokens. It is possible that this could cause significant sell pressure in the market.
Solana Price Breakout Catalyzes Upward MovementThe daily timeframe technical analysis suggests that the bounce will continue. This analysis comes from both the price action and the RSI.
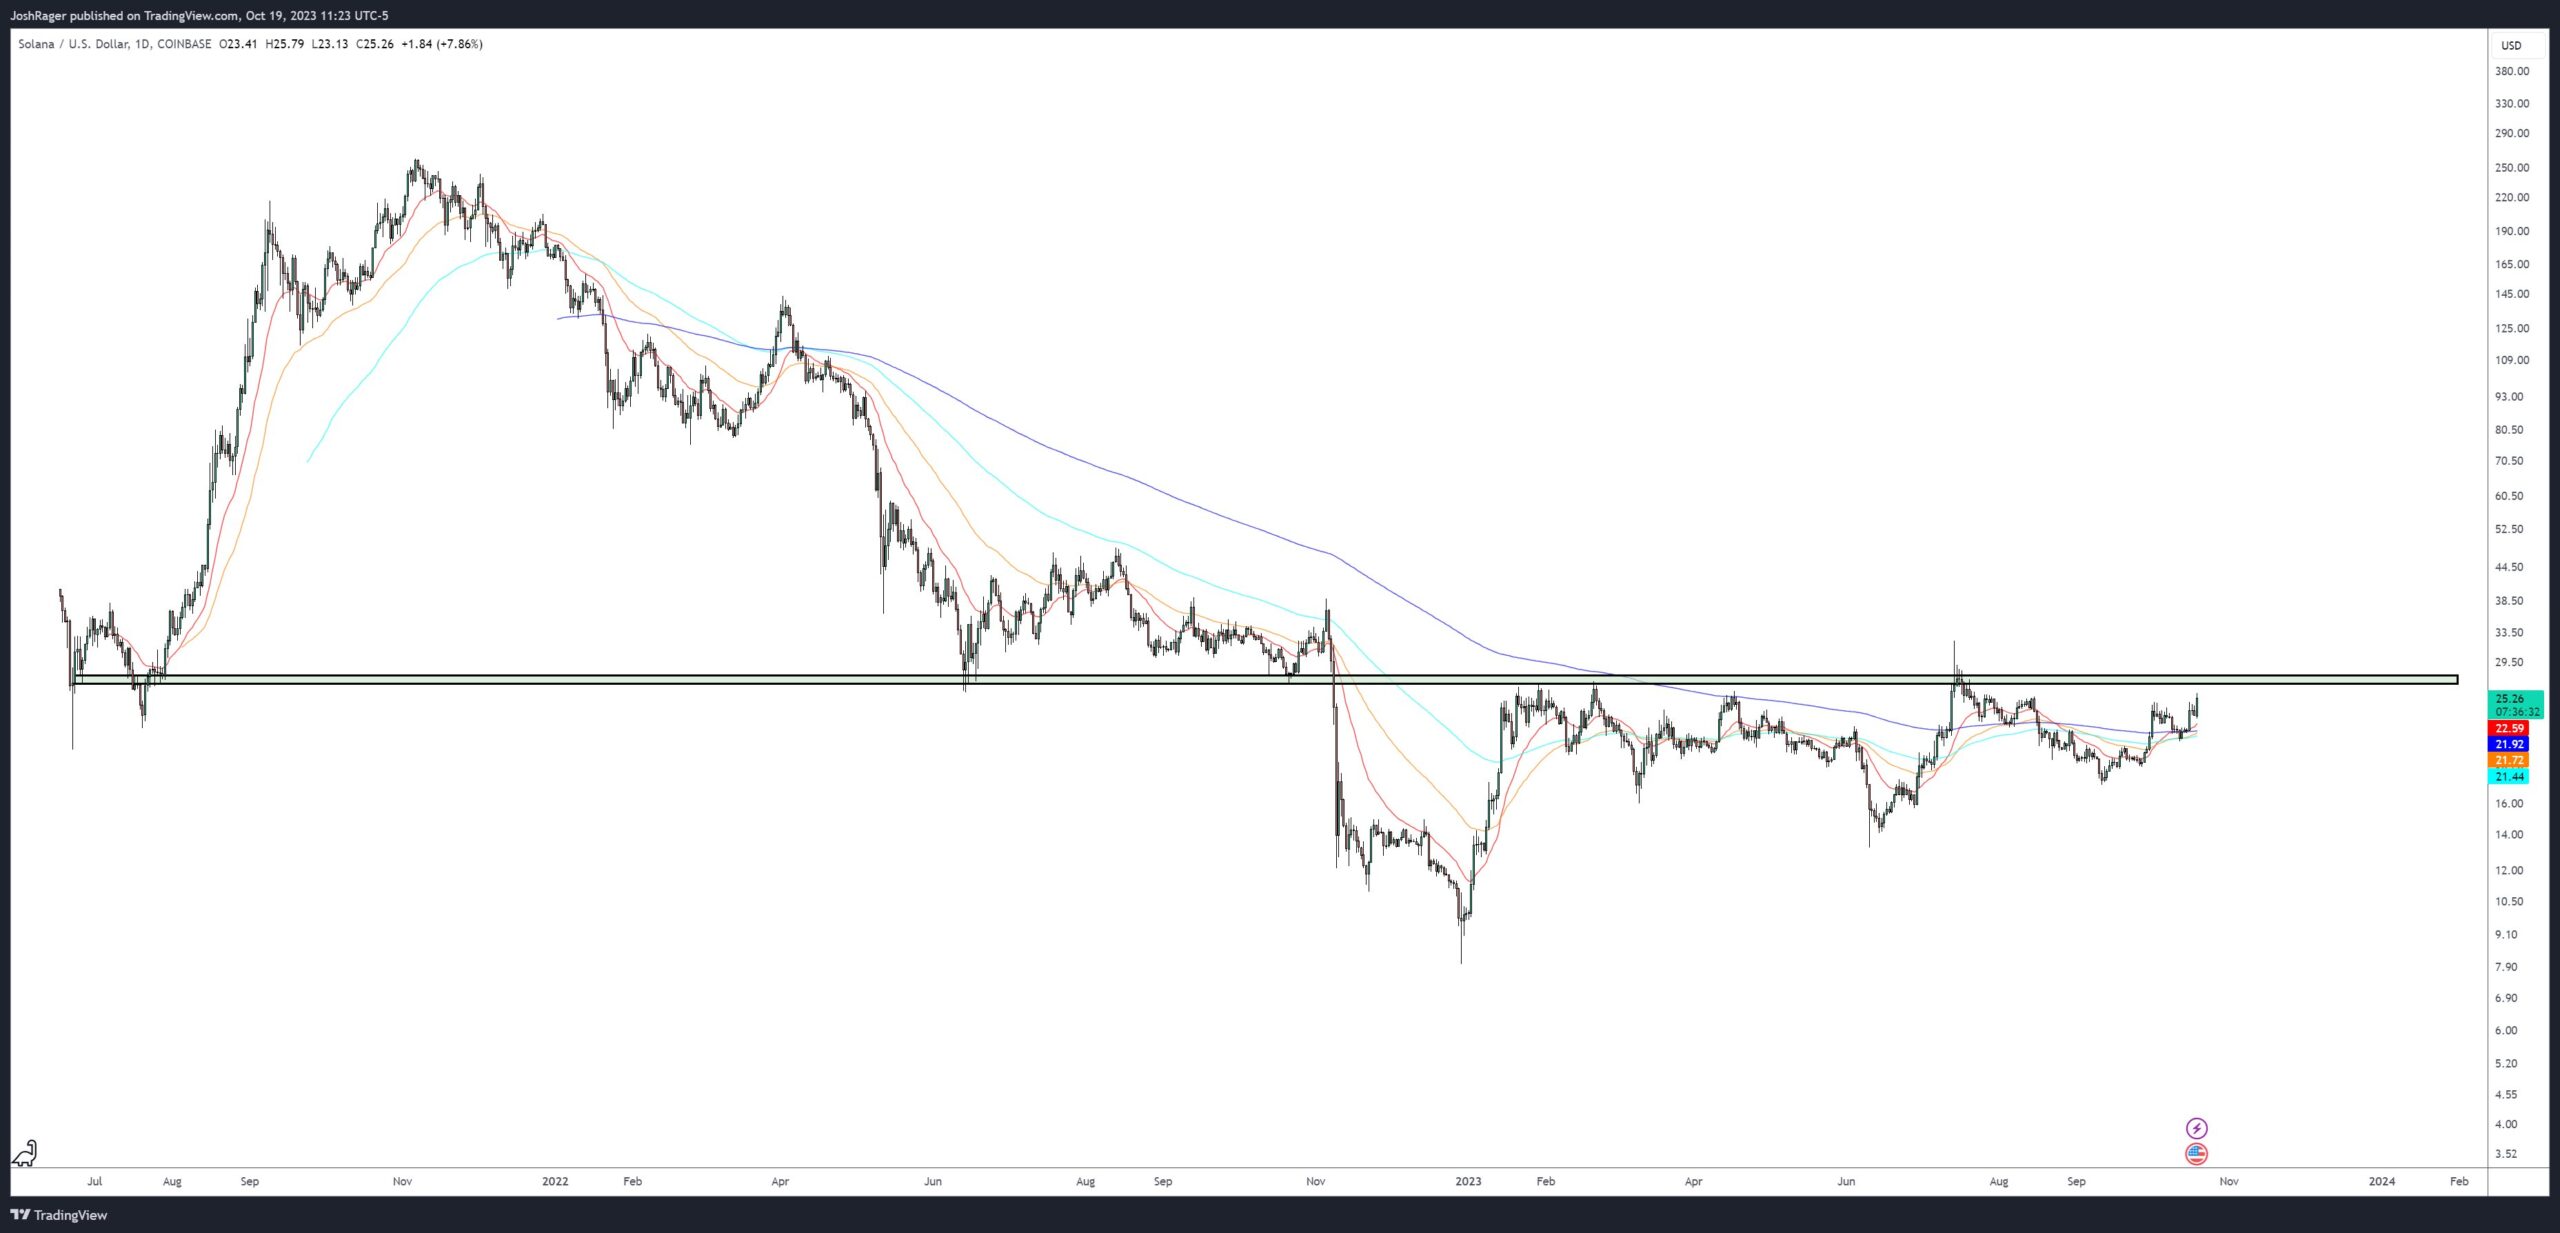
On Sept. 11, the SOL price bounced at a long-term ascending support line, which has been in place since the beginning of the year. Bounces from such long-term support levels are expected to initiate significant upward movements.
This was the case in SOL, which broke out from a descending wedge on September 18. Both the validation of the long-term support and the breakout from the wedge are considered strong bullish signs.
Therefore, the Solana price breakout and the bounce support the continuing increase toward the range high.
Furthermore, the six-hour RSI is bullish. The indicator broke out from a descending resistance line (green) and has now moved above 50.
SOL/USDT Daily Chart. Source: TradingViewTherefore, the Solana price prediction is bullish, and a 35% increase to the range high is likely.
This bullish prediction will be invalidated by a breakdown below $18, which could cause a 38% drop to $13.
Check Out the Top 11 Crypto Communities To Join in 2023
For BeInCrypto’s latest crypto market analysis, click here
The post Solana (SOL) Price Moves Above $20 – Will $1.16 Billion FTX Liquidation Present an Obstacle? appeared first on BeInCrypto.
origin »ETH/LINK Price Action Candlestick Set (LINKETHPA) на Currencies.ru
|
|


