2023-7-11 20:00 |
The Solana (SOL) price broke out from long- and short-term resistance lines, going a long way in confirming that the price has begun a bullish trend reversal.
The SOL price has been on a tear since its June 10 low and shows no signs of weakness in either long- or short-term time frames.
Read More: Best Upcoming Airdrops in 2023
Solana Price Breaks out From 600-Day ResistanceA look at the weekly time frame shows that SOL broke out from a long-term descending resistance line last week. Before doing so, the line had been in place since the all-time high in November 2021, specifically for 600 days. Breakouts from such long-term structures usually indicate that the previous trend has ended and a new one has begun in the other direction.
In SOL’s case, the price has likely begun a new bullish trend reversal.
SOL/USD Weekly Chart. Source: TradingViewWhile the daily RSI supports the breakout, it has not confirmed it yet. The indicator has made a higher low and is increasing but is right at 50. By using the RSI as a momentum indicator, traders can determine whether a market is overbought or oversold and decide whether to accumulate or sell an asset.
Bulls have an advantage if the RSI reading is above 50 and the trend is upward, but if the reading is below 50, the opposite is true. A movement and weekly close above the line will confirm that the bullish trend reversal has begun.
Read More: Top 9 Telegram Channels for Crypto Signals in 2023
SOL Price Prediction: Price Recovers, Reclaims Crucial Support – Up Next?According to the technical analysis of the daily timeframe, a 71% price recovery started on June 10. This recovery began with a long lower wick, indicating increased buying pressure.
The significance of this price increase is that SOL (the cryptocurrency) managed to regain the $17 horizontal level. Previously, this level was expected to act as resistance after a breakdown. However, after a minor rejection on June 20, the SOL price surged above the $17 area and peaked at $20 on June 30.
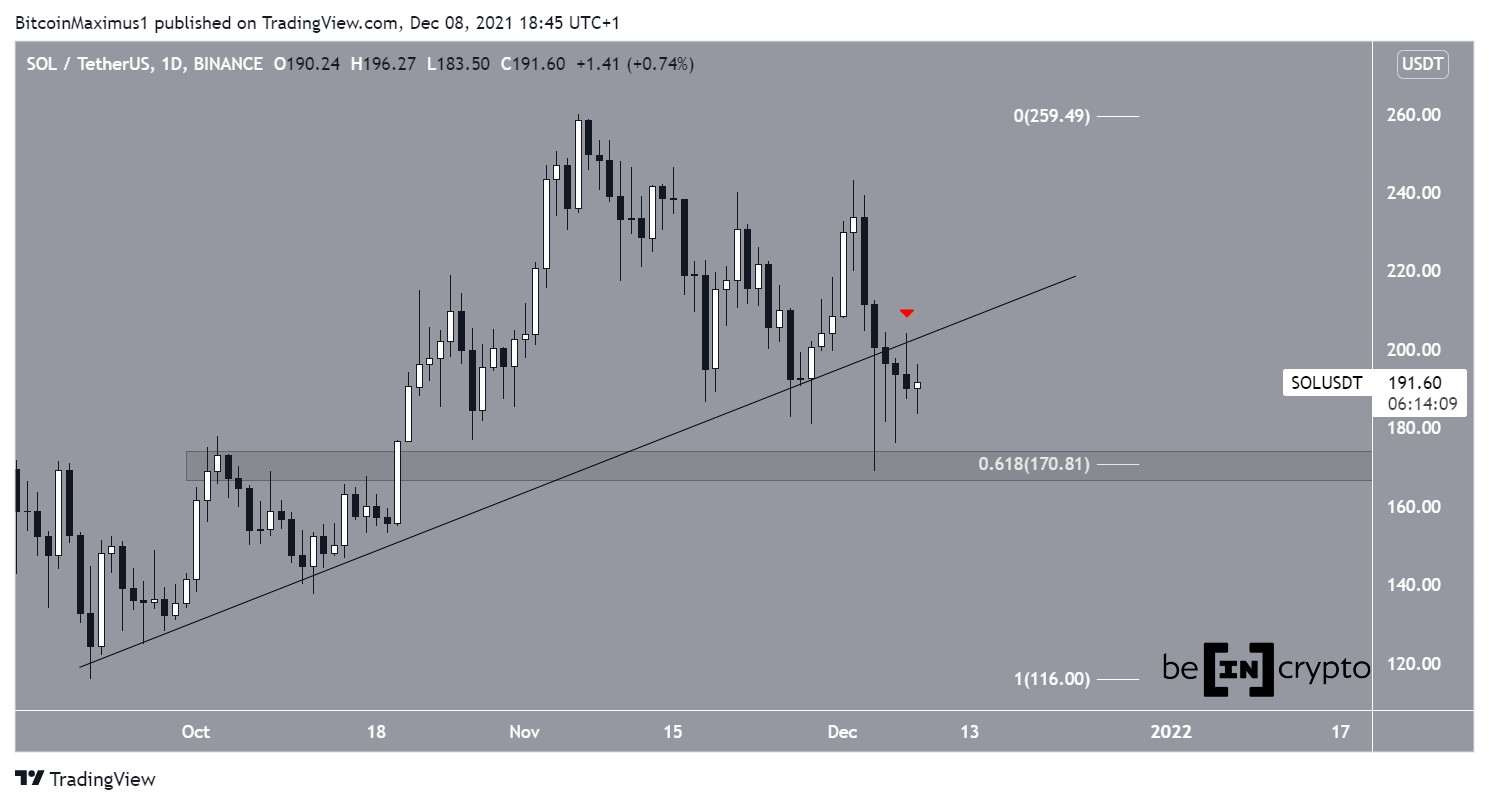
Then, the SOL price broke out from descending resistance line that has been in place since April 17. A successful breakthrough above this line went a long way in confirming that the trend is bullish, even in the short term.
Furthermore, the daily RSI is above 50 and increasing, supporting the legitimacy of the breakout.
If the upward movement continues, the next resistance will be at $26, created by the yearly high.
SOL/USDT Daily Chart. Source: TradingViewDespite this bullish SOL price prediction, the price could fall to the descending resistance line at $18 if it loses its footing. However, no short-term signs indicate this is likely to transpire.
More From BeInCrypto: 9 Best AI Crypto Trading Bots to Maximize Your Profits
For BeInCrypto’s latest crypto market analysis, click here
The post Solana (SOL) Price Breaks 600-Day Bearish Pattern: Bullish Sign for Investors appeared first on BeInCrypto.
origin »Bitcoin price in Telegram @btc_price_every_hour
ETH/LINK Price Action Candlestick Set (LINKETHPA) на Currencies.ru
|
|

