RAYDIUM PRICE ANALYSIS & PREDICTION (October 28) – Ray Explodes To 7-Month High But Faces Rejection, Incoming Retracement

2024-10-28 05:11

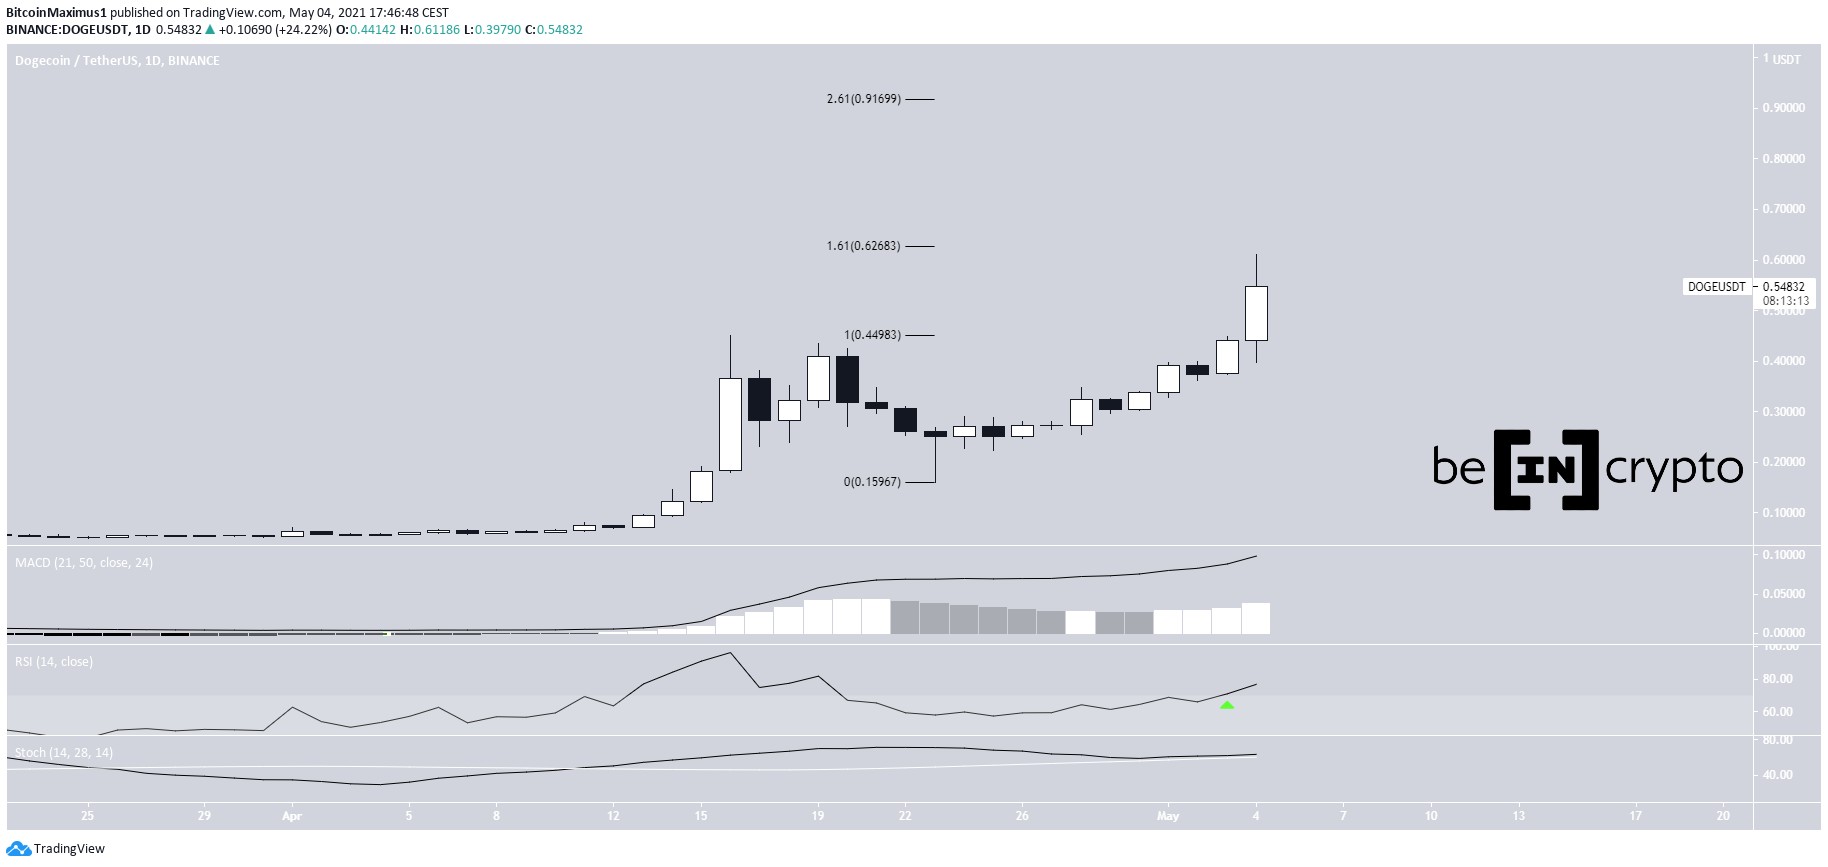
After holding well above $1.2 during the correction phase, RAY slowly regained momentum and later exploded with a double bottom. It tested a seven-month high today but slightly lost grip due to a rejection.

Ray’s latest rally was triggered by a surge from base support of $1.56 three weeks ago, although it faced some hurdles under the critical $2 resistance level (now support) before the price broke out.

That breakout brought a surge in volatility and the price exploded to a high of $3.19 after seven months of trading. Due to a sudden rejection, it retraced briefly from that high and fell to a daily low of $2.76. It has recovered from there and now trades above $3.

A continuous surge in volatility could bring full recovery to the key $3.3 level, where it initiated a correction in March. Technically, that level marks a major breakpoint for a long-term bullish momentum.

If Ray surpasses that key level, a bigger rally should be anticipated. The key price range for such a rally would be $10 shortly. However, trading looks calm at the time of writing.

Considering the recent rejections, buying pressure seems to be reaching an exhaustion point on the daily timeframe. Ray may initiate a small retracement if a drop occurs before resuming bullish.

RAY’s Key Level To Watch Source: Tradingview

Looking ahead, it may retake the current daily high in the next few hours. Breaking through March’s high could rally the price to $4 in no time. The next level to watch for an increase is $5

There are a lot of supports for Ray towards the downside. For a pullback, the $2.7 and $2.4 levels are the closest support for a rebound. Below it lies $2.2.

Key Resistance Levels: $3.3, $4, $5

Key Support Levels: $2.7, $2.4, $2.2

Spot Price: $3 Trend: Bullish Volatility: High

Disclosure: This is not trading or investment advice. Always do your research before buying any cryptocurrency or investing in any services.

Follow us on Twitter @nulltxnews to stay updated with the latest Crypto, NFT, AI, Cybersecurity, Distributed Computing, and Metaverse news!

Image Source: aoo3771/123RF // Image Effects by Colorcinch

origin »

Bitcoin price in Telegram @btc_price_every_hour

High Voltage (HVCO) на Currencies.ru

$ 0.0012187 (+0.56%)
Объем 24H $0
Изменеия 24h: 0.13 %, 7d: -0.82 %
Cегодня L: $0.0012066 - H: $0.0012233
Капитализация $0 Rank 8594
Доступно / Всего 0 HVCO

high rejection ray exploded double later slowly

high rejection → Результатов: 82


Coinbase Whales Keep Buying Bitcoin as Price Rockets to New All-Time Highs

Bitcoin is in the process of consolidating after the cryptocurrency saw a push to all-time highs last night, which led it as high as $36,000 This movement came about suddenly and was quite surprising, but it didn’t last for long The rejection at these highs was not too grave, as BTC has been able to find some strong support within the lower-$34,000 region ever since There’s a strong possibility that it will consolidate here, as […]

2021-1-7 21:00


Фото:

If History Rhymes, This Indicator Suggests Bitcoin May See a Parabolic Explosion

Bitcoin has seen some mixed price action as of late, with bulls being unable to take control of its trend in the time following its rally up to $28,500 The rejection here was quite intense, and it has yet to show any signs of strength in the time following this occurrence The fact that bulls have guarded against any deeper drawback is positive because it invalidates the possibility that this recent high is a blow-off […]

2020-12-30 21:00


Economist: Bitcoin Remains a “Risk On” Asset After Reacting to Payroll Data

Bitcoin saw some slight turbulence over the past few days, with its price rallying as high as $9,300 before facing a rejection that caused it to slide beneath $9,000 for a brief period. This volatility appeared to be directly linked to news regarding US payroll numbers, signaling that the cryptocurrency presently remains highly correlated to […]

2020-7-4 05:00


Фото:

Here’s Why Bitcoin Could Rally to $10,000 Before Seeing a Brutal Decline

Bitcoin’s intense volatility seen yesterday didn’t let up overnight, as the benchmark cryptocurrency pushed as high as $9,500 before facing a swift rejection The crypto has been able to stabilize within the upper-$8,000 region in the time since Analysts are now noting that this strong upwards momentum could lead BTC as high as $10,000, although it may face a brutal rejection at this level that leads it significantly lower Bitcoin and the aggregated cryptocurrency market […]

2020-5-1 21:00


Bitcoin price rises to $6,900: a point that kickstarted the last rally to $10,000

The Bitcoin price spiked to $6,900 on the day, rising to as high as $6,946 on BitMEX. The last BTC rally to over $10,000 started from a strong rebound from the $6,900 level. Upon rising to $6,900, the Bitcoin price saw an immediate rejection to the mid-$6,000 region, and some technical analysts anticipate a minor […] The post Bitcoin price rises to $6,900: a point that kickstarted the last rally to $10,000 appeared first on CryptoSlate.

2020-3-20 18:25


Фото:

Bitcoin Price Analysis: Upward Drift Continues Following Established Macro Support

Since mid-February, the bitcoin market has continued to drift upward toward a band of strong, macro resistance (shown below as a red band). This slow, drift upward marks our fourth test of the resistance zone and, unlike the three prior tests, our rejection of the level has shown a weakness on the side of the bears:Figure 1: BTC-USD, Daily Candles, Fourth RejectionIf we compare the three prior rejections (labeled 1, 2 and 3), we see that the move into this resistance level was violent — and had equally violent rejections.

2019-3-29 02:21


Фото:

Bitcoin Price Analysis: Low Time Frames Show Signs of Life Amid Weekly Tests

Bitcoin continues to coil tightly within its range-bound market as the bulls and bears fight it out to see which is most dominant. On the lower time frames (TF), bitcoin is managing to find support:Figure 1: BTC-USD, 2-Hour Candles, Low TF SupportThe zone outlined by the green line in Figure 1 represents local support that has kept the market afloat for the last week and a half.

2019-3-13 22:26


Фото:

Bitcoin Price Analysis: New High Paves Potential Reversal Setup

After days and days of consolidation, bitcoin finally managed to break a new high for the first time in almost two weeks. This new high, so far, has been short lived, however, as it was almost immediately sold into by eager bears:Figure 1: BTC-USD, 4-Hour Candles, New HighOur current 4-hour candle is seeing a relatively easy retracement after days and days of an upward grind.

2019-3-9 02:08


Фото:

Bitcoin Price Analysis: Keep an Eye Out for a Close Above the Current High

Shortly after falling from its test of the low $4,000s, bitcoin managed to find support in the mid $3,500s. This has proven to be a relevant level over the last few months, and finding support here would be a sign of relatively strong demand:Figure 1: BTC-USD, Daily Candles, Local SupportThe high candle spread rejection following our test of the low $4,000s was an indication that we had strong levels of supply left in the market, but for the time being we are holding support.

2019-3-1 03:44


Фото:

Bitcoin Price Analysis: Bullish Rejection Wipes Out Bitcoin’s Weekend Gains

Over the weekend, a strong rally was stifled by an even stronger rejection as the bitcoin market was shoved into a band of overhanging resistance. This band of resistance has been mentioned several times in our analyses over the last few weeks as it has proven impossible to overcome for the time being:Figure 1: BTC-USD, Daily Candles, Failed BreakoutThis run to the low $4,000s coincided with a breakout of a rather large symmetrical triangle consolidation shown above.

2019-2-26 02:42


Фото:

Bitcoin Price Analysis: Range-Bound Market Coiled for Next Move

For the better part of a month and a half, bitcoin has been fairly range-bound and unable to establish new lows or new highs. There are some bullish and bearish setups on the horizon for bitcoin, so let’s check out both sides of the argument because currently the market is sitting in the middle of Indecisionville — the most immediate sign of which is this glaringly obvious head-and-shoulders bottom reversal pattern:Figure 1: BTC-USD, Daily Candles, Head-and-Shoulders BottomThis current pattern is nothing more than a setup at the moment, but it represents one potential outcome of this sustained consolidation.

2019-1-4 02:22