2022-7-23 13:30 |
Be[In]Crypto takes a look at the five cryptocurrencies that decreased the most last week, more specifically, from July 15 to 22.
These cryptocurrencies are:
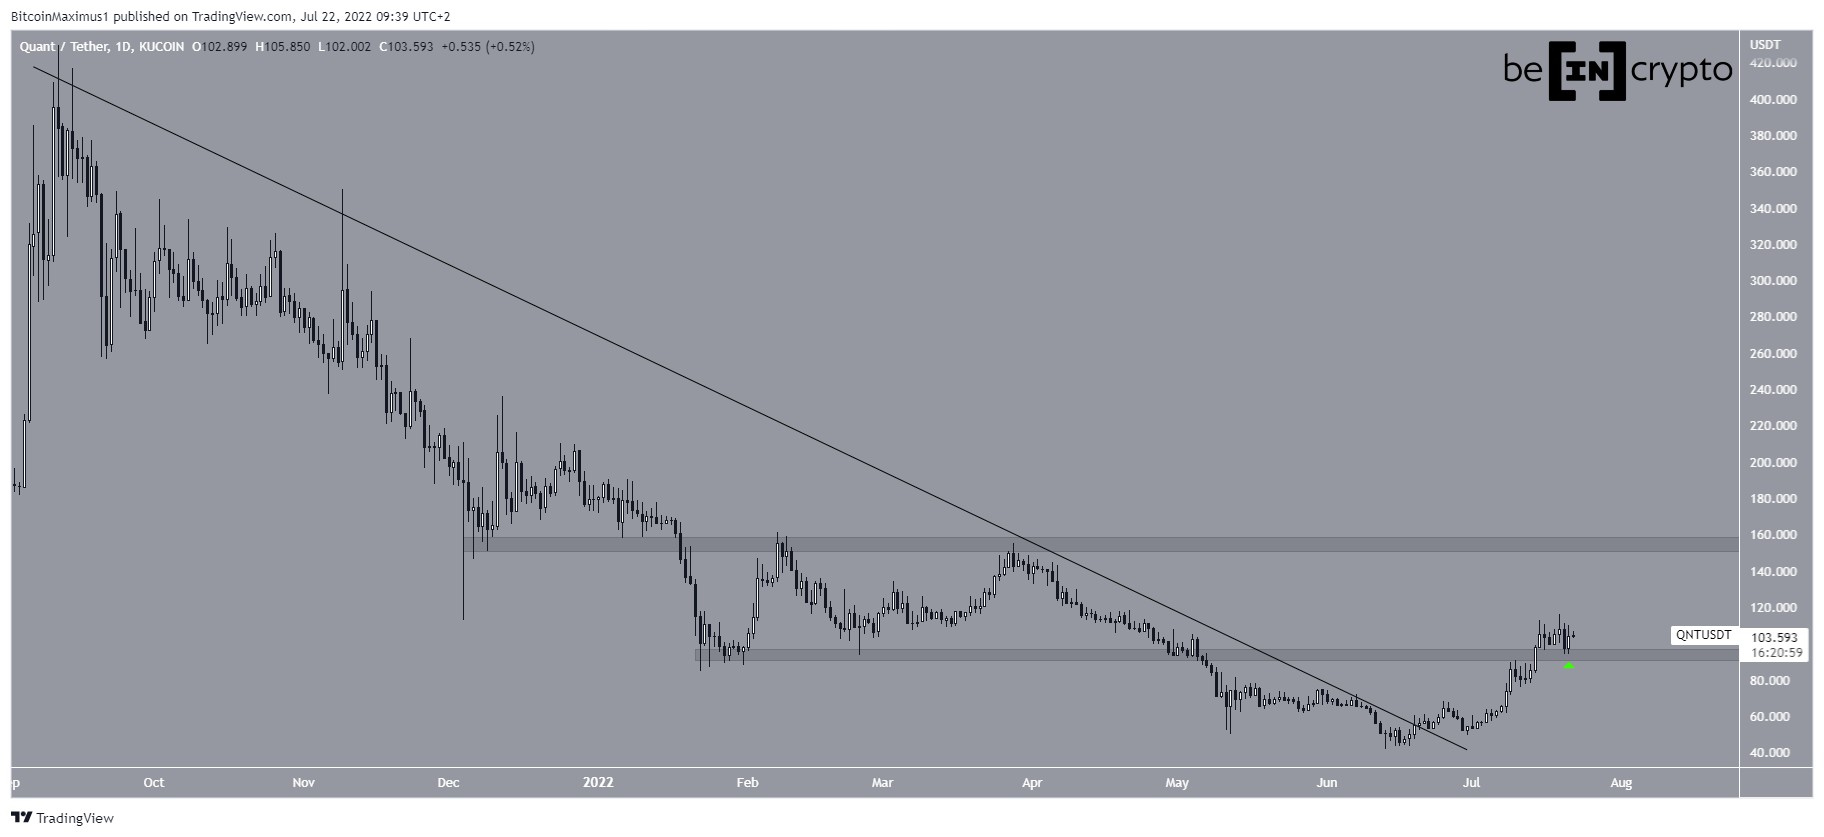
Quant (QNT) : -4.93%Serum (SRM) : -4.08% Elrond (EGLD) : -3.35% SushiSwap (SUSHI) : -0.73% Internet Computer (ICP) : -0.59% QNTOn June 20, QNT broke out from a descending resistance line that had previously been in place since the Sept 2021 all-time high price. It proceeded to reach a high of $115 on July 19.
While the price has decreased slightly since, it bounced at the $100 horizontal area, validating it as support in the process. If QNT continues to increase, the next closest resistance area would be at $155.
QNT/USDT Chart By TradingView SRMSimilar to QNT, SRM broke out from a descending resistance line on June 1. However, it has yet to initiate any sort of significant upward movement, instead hovering at the breakout level.
Nevertheless, the daily RSI has generated bullish divergence and has now moved above 50. This is a sign usually associated with a bullish trend.
If an upward movement transpires as a result, the next closest resistance area would be at $1.90.
SRM/USDT Chart By TradingView EGLDEGLD has been moving upwards inside a symmetrical triangle since June 13. More recently, it was rejected by the resistance line of the triangle on July 19 and is back close to its support line.
The symmetrical triangle is considered a neutral pattern, meaning that both a breakout and breakdown are equally likely.
The closest resistance and support levels are at $67 and $47, respectively.
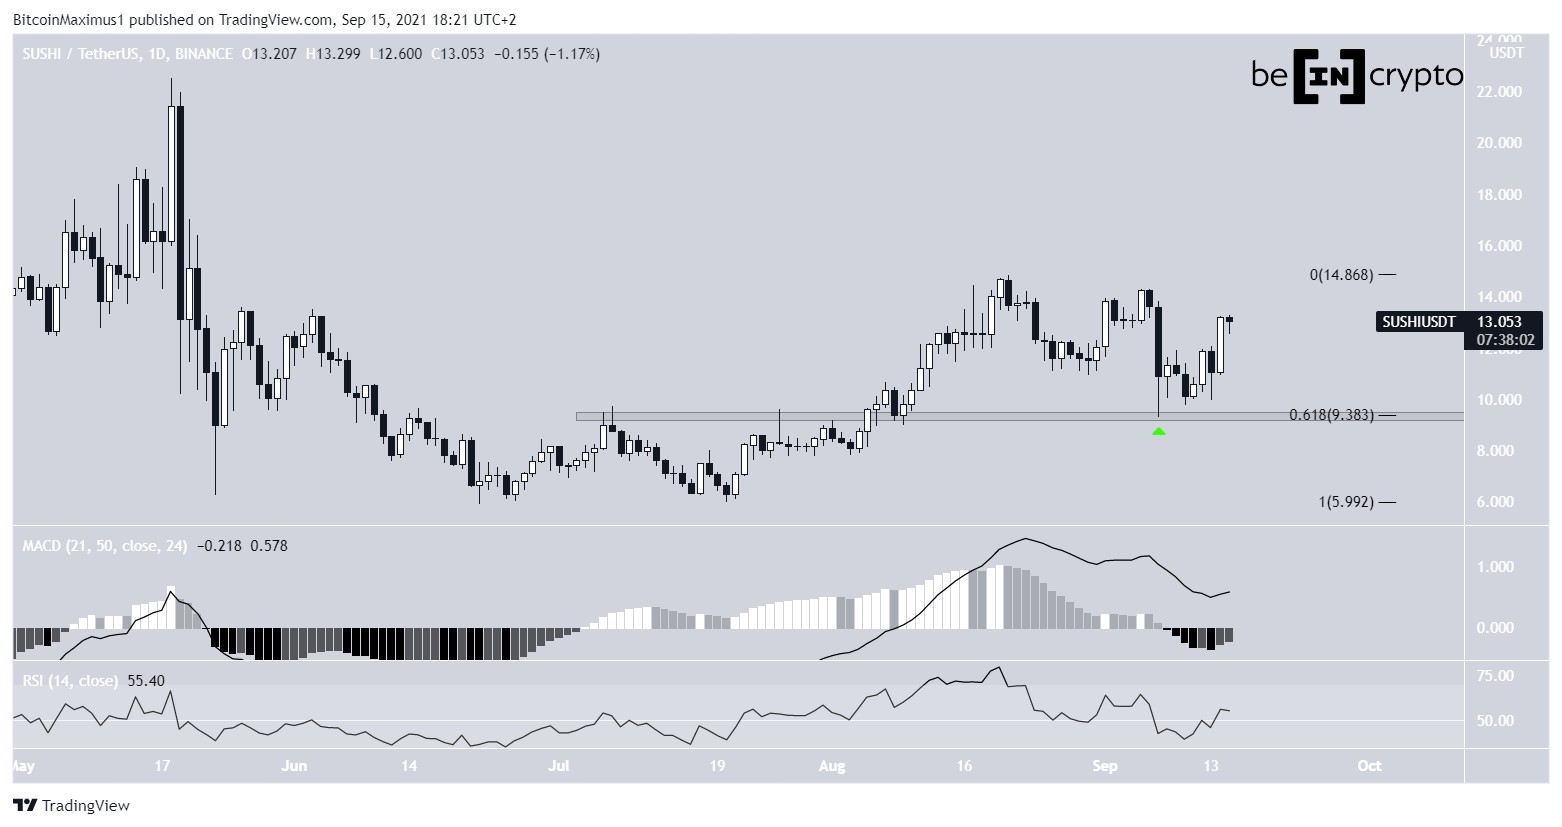
EGLD/USDT Chart By TradingView SUSHIOn June 13, SUSHI broke down from the $1.10 horizontal area. Despite the breakout, it initiated an upward movement shortly afterwards and reclaimed the area, rendering the previous breakdown as only a deviation (red circle).
Since then, SUSHI has created several higher lows and could be following an ascending support line, which has not been sufficiently validated yet.
If the upward movement continues, the next closest resistance area is at $1.87.
SUSHI/USDT Chart By TradingView ICPICP has been increasing inside an ascending parallel channel since June 19. This upward movement led to a high of $7.84 on July 18. Parallel channels are considered corrective movements, meaning that a breakdown would be the most likely scenario.
Therefore, ICP has to break out from the channel in order for the trend to be considered bullish. If it manages to do so, it could increase all the way to $9.45.
ICP/USDT Chart By TradingViewFor Be[in]Crypto’s latest Bitcoin (BTC) analysis, click here
The post Quant (QNT) Retraces After Breakout From 280-Day Resistance Line – Biggest Weekly Losers appeared first on BeInCrypto.
origin »Bitcoin price in Telegram @btc_price_every_hour
Resistance (RES) на Currencies.ru
|
|